
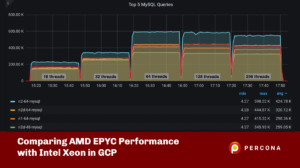
 Recently we were asked to check the performance of the new family of AMD EPYC processors when using MySQL in Google Cloud Virtual Machines. This was motivated by a user running MySQL in the N1 machines family and willing to upgrade to N2D generation considering the potential cost savings using the new AMD family.
The idea behind the analysis is to do a side-by-side comparison of performance considering some factors:
The goal of this analysis is to check if cost reductions by upgrading from N1 to N2D are worth the change to avoid suffering from performance problems and eventually reduce the machine size from the current 64 cores based (N1 n1-highmem-64 – Intel Haswell) to either N2D 64 cores (n2d-highmem-64 – AMD Rome) or even to 48 cores (n2d-highmem-48 – AMD Rome), to provide some extra context we included N2 (the new generation of Intel machines) into the analysis.
In order to do a purely CPU performance comparison we created 4 different VMs:
NAME: n1-64
MACHINE_TYPE: n1-highmem-64
Intel Haswell – Xeon 2.30GHz
*This VM corresponds to the same type as the type we use in Production.
NAME: n2-64
MACHINE_TYPE: n2-highmem-64
Intel Cascade Lake – Xeon 2.80GHz
NAME: n2d-48
MACHINE_TYPE: n2d-highmem-48
AMD Epyc Rome – 2.25Ghz
NAME: n2d-64
MACHINE_TYPE: n2d-highmem-64
AMD Epyc Rome – 2.25Ghz
For the analysis, we used MySQL Community Server 5.7.35-log and this is the basic configuration:
|
1 2 3 4 5 6 7 8 9 10 11 12 13 14 15 16 17 18 19 20 21 22 23 24 25 26 27 28 29 30 |
[mysqld] datadir = /var/lib/mysql socket = /var/lib/mysql/mysql.sock log-error = /var/lib/mysql/mysqld.err pid-file = /var/run/mysqld/mysqld.pid server_id = 100 log_bin binlog_format = ROW sync_binlog = 1000 expire_logs_days = 2 skip_name_resolve innodb_buffer_pool_size = 350G innodb_buffer_pool_instances = 32 innodb_concurrency_tickets = 5000 innodb_thread_concurrency = 128 innodb_write_io_threads = 16 innodb_read_io_threads = 16 innodb_flush_log_at_trx_commit = 1 innodb_flush_method = O_DIRECT innodb_log_file_size = 8G innodb_file_per_table = 1 innodb_autoinc_lock_mode = 2 innodb_buffer_pool_dump_at_shutdown = 1 innodb_buffer_pool_load_at_startup = 1 table_open_cache = 5000 thread_cache_size = 2000 query_cache_size = 0 query_cache_type = 0 |
In all cases, we placed a 1TB balanced persistent drive so we get enough IO performance for the tests. We wanted to normalize all the specs so we can focus on the CPU performance, so don’t pay too much attention to the chances for improving performance for IO operations and so.
The analysis is based on sysbench oltp read-only workload with an in-memory dataset, the reason for this is that we want to generate traffic that can saturate CPU while not being affected by IO or Memory.
The approach for the benchmark was also simple, we executed RO OLTP work for 16, 32, 64, 128, and 256 threads with a one-minute wait between runs. Scripts and results from tests can be found here.
Let’s jump into the analysis, these are the number of Queries that instances are capable to run:
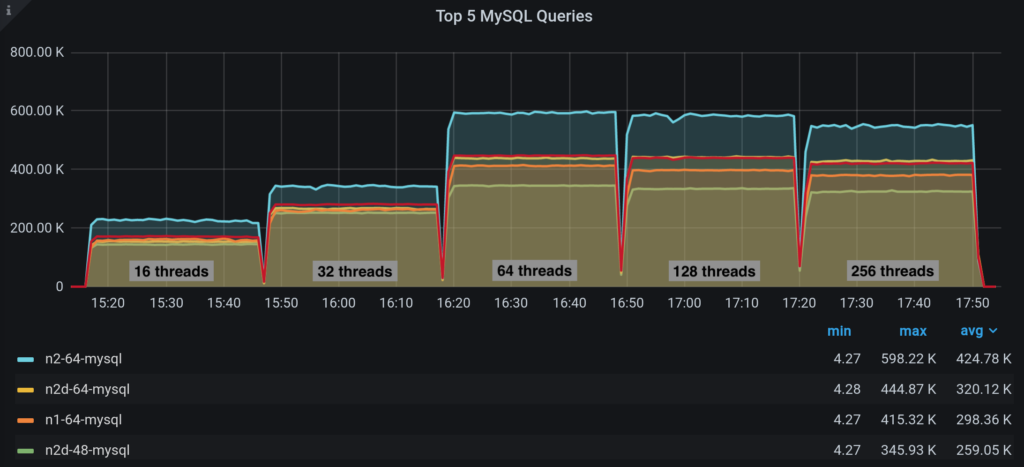
The maximum amount of TPS by Instance Type by the number of threads:
| Threads/Instance | N1-64 | N2-64 | N2D-48 | N2D-64 |
|
16
|
164k | 230k | 144k |
155k
|
|
32
|
265k | 347k | 252k | 268k |
|
64
|
415k | 598k | 345k |
439k
|
|
128
|
398k | 591k | 335k |
444k
|
| 256 | 381k | 554k | 328k |
433k
|
Some observations:
Let’s have a look at the CPU utilization on each node:
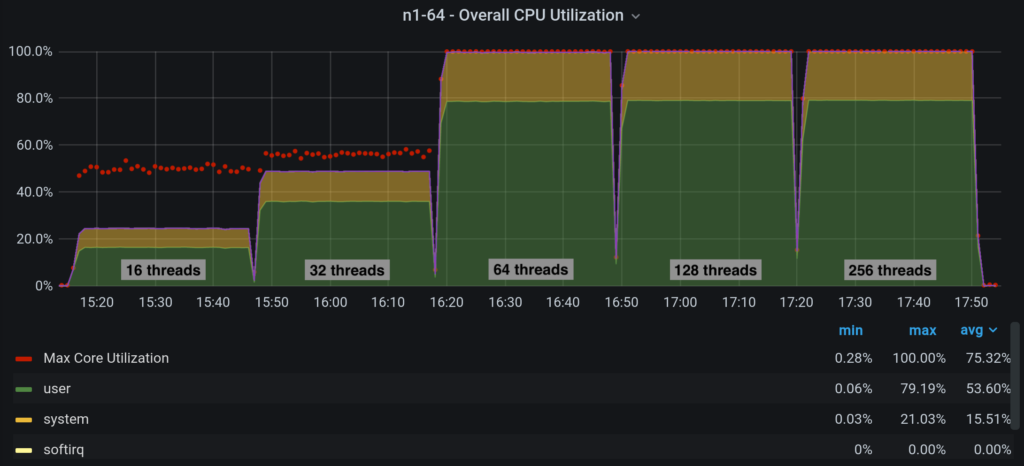

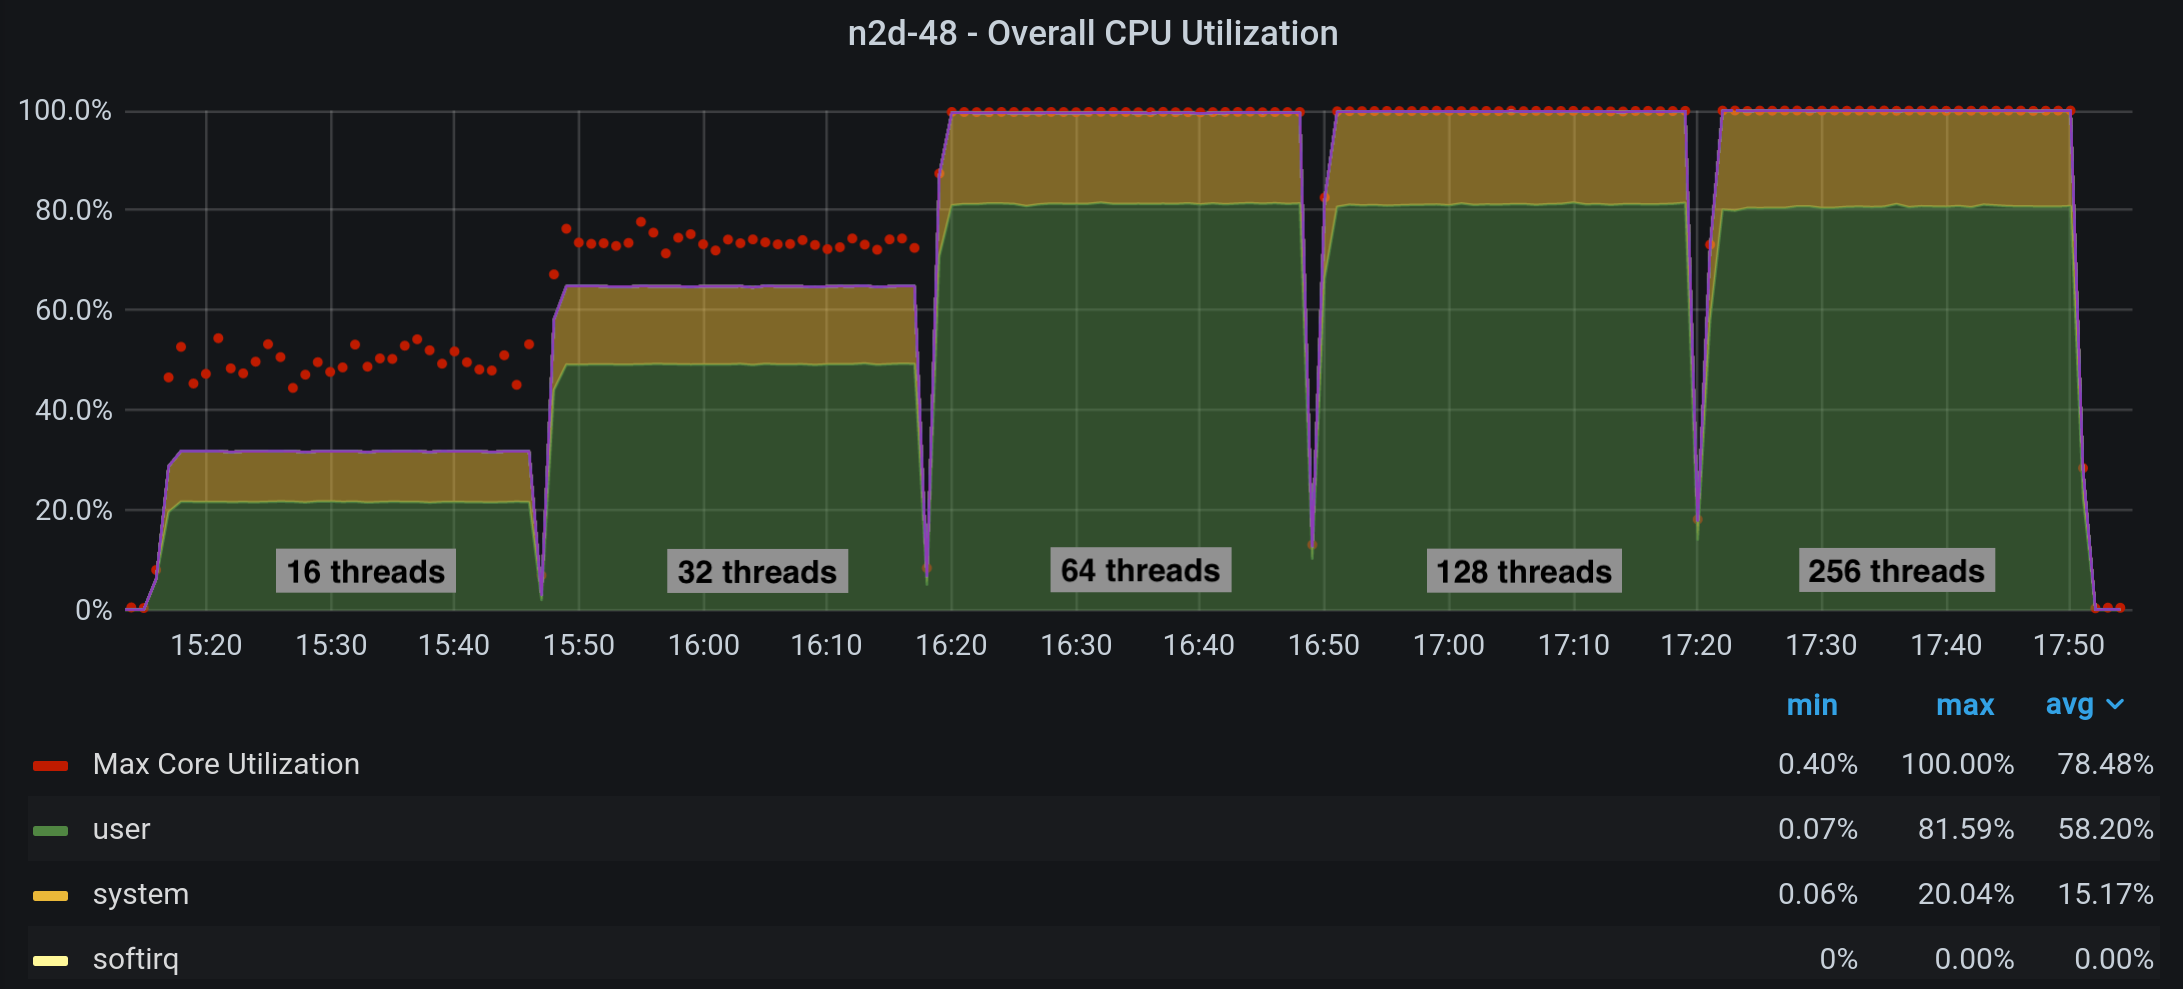
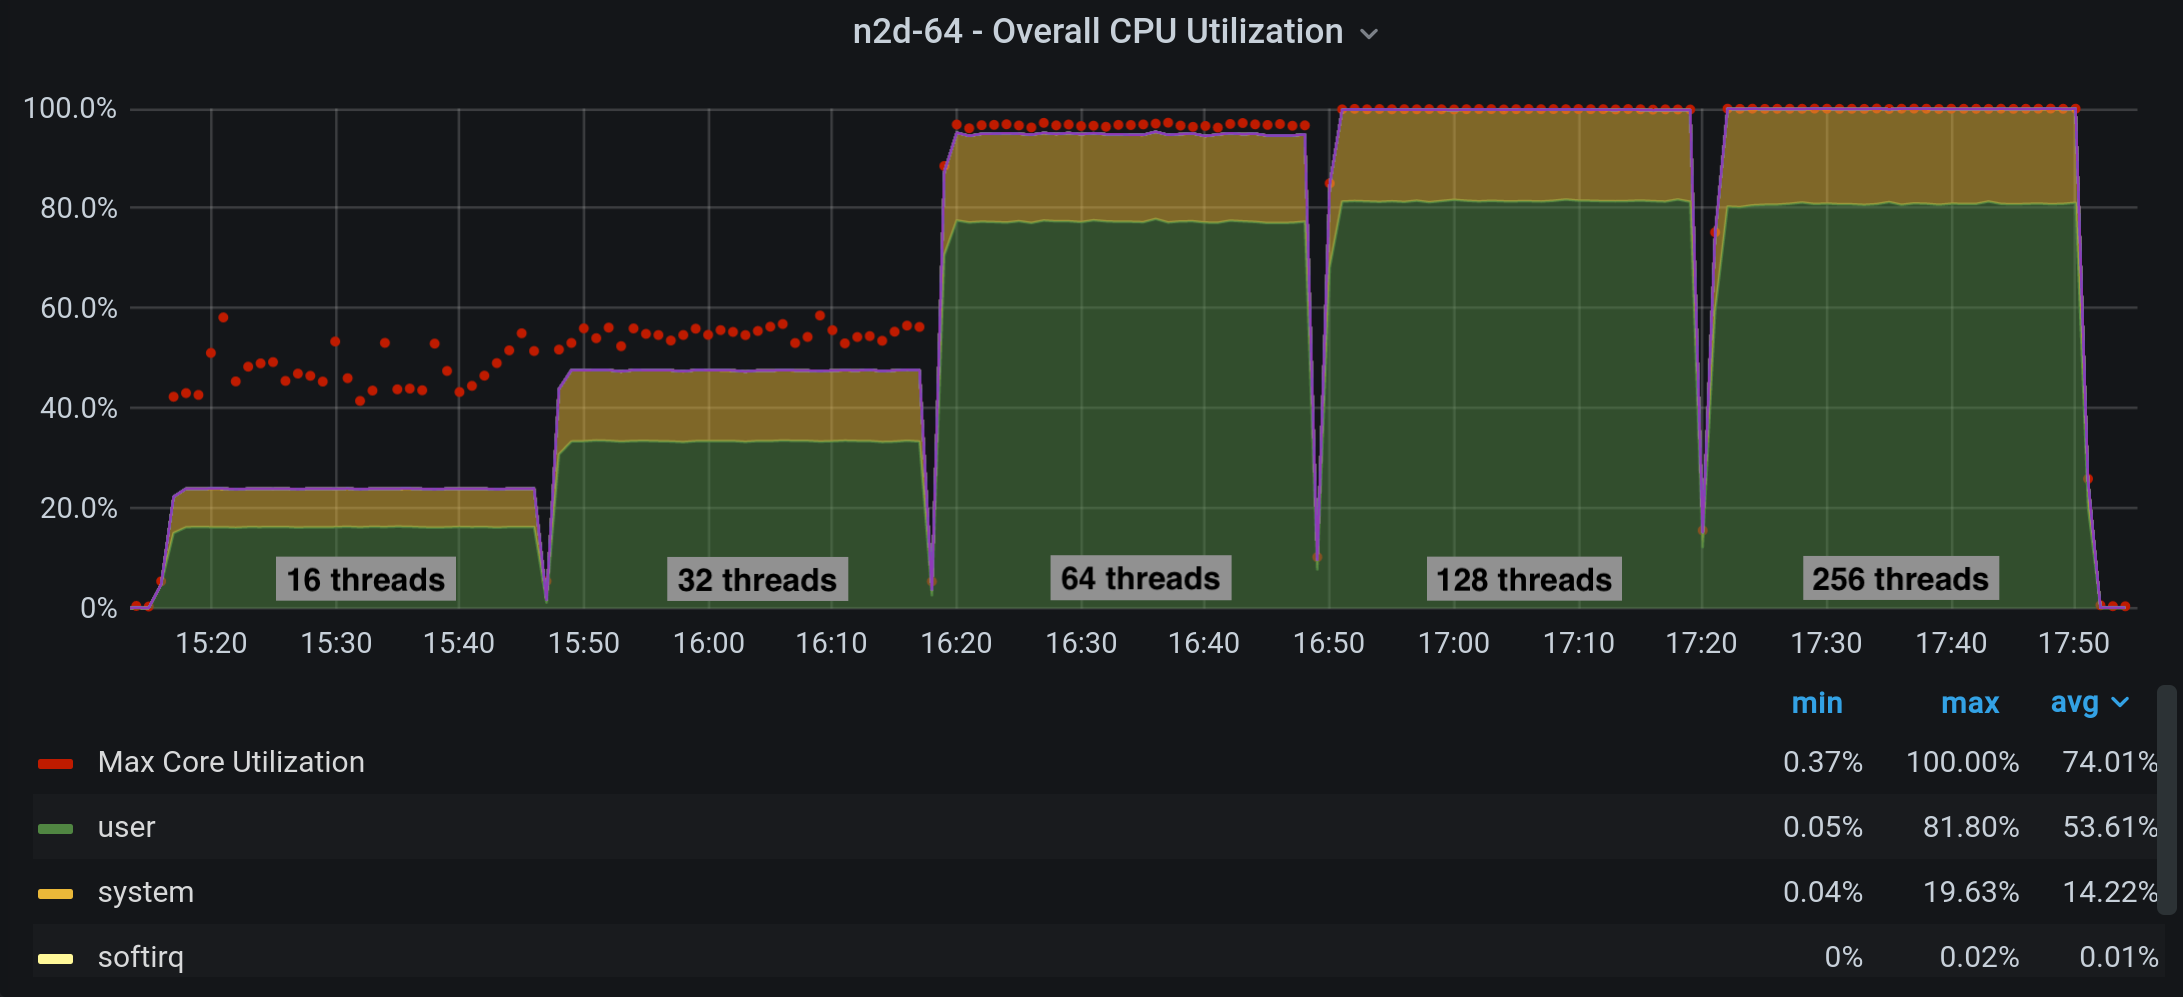
Additional observations:
For the sake of analysis this is the estimated costs of each of used machines (at the moment of writing the post):
n1-highmem-64 $2,035.49/month = $0.000785297/second
n2-highmem-64 $2,549.39/month = $0.000983561/second
n2d-highmem-48 $1,698.54/month = $0.000655301/second
n2d-highmem-64 $2,231.06/month = $0.000860748/second
Costs above will give us roughly at peaks of TPS:
n1-highmem-64 costs are $0.0000000019/trx
n2-highmem-64 costs are $0.0000000016/trx
n2d-highmem-48 costs are $0.0000000019/trx
n2d-highmem-64 costs are $0.0000000019/trx
While this is not a super exhaustive analysis of all implications of CPU performance for MySQL workload we get a very good understanding of cost vs performance analysis.
Resources
RELATED POSTS


Check fio and what max IOPS/tput you get on both platforms – in my tests, n2d showed poor performance and it was confirmed by GCP engineers that there are disk IO issues with EPYC in their infra.
Nikolay, thanks for your feedback. The purpose is not to compare the performance of storage per family but CPU bound workload, thus we haven’t configured or done any performance tuning other than having a dataset that fits in memory so we can get rid of the IO issues.
Francisco, my comment was triggered by the word “GCP” in the title – it’s important that GCP has issues with EPYCs basically making them look not well compared to old school Xeons. Which is sad because in other environments, EPYCs look really well and cost efficient.
Nikolay, that’s interesting because I was a bit surprised by the results, do you happen to have some extra information about this problem? if so I’d be glad to check it and eventually trigger some extra benchmarks and see what’s the potential for cost savings (which is actually the main reason for this post)
MySQL 5.7? Why not MySQL 8.0?