
In this blog post, I’ll review how a hung MySQL transaction can cause the InnoDB history length to grow and negatively affect MySQL performance.
Recently I was helping a customer discover why SELECT queries were running slower and slower until the server restarts (which got things back to normal). It took some time to get from that symptom to a final diagnosis. Please follow me on the journey of chasing this strange MySQL behavior!
Symptoms
Changes in the query response time can mean tons of things. We can check everything from the query plan to the disk performance. However, fixing it with a restart is less common. After looking at “show engine innodb status”, I noticed some strange lines:
|
1 2 3 4 |
Trx read view will not see trx with id >= 41271309593, sees < 41268384363 ---TRANSACTION 41271309586, ACTIVE 766132 sec 2 lock struct(s), heap size 376, 0 row lock(s), undo log entries 1 ... |
There was a total of 940 transactions like this.
Another insight was the InnoDB transaction history length graph from Percona Monitoring and Management (PMM):
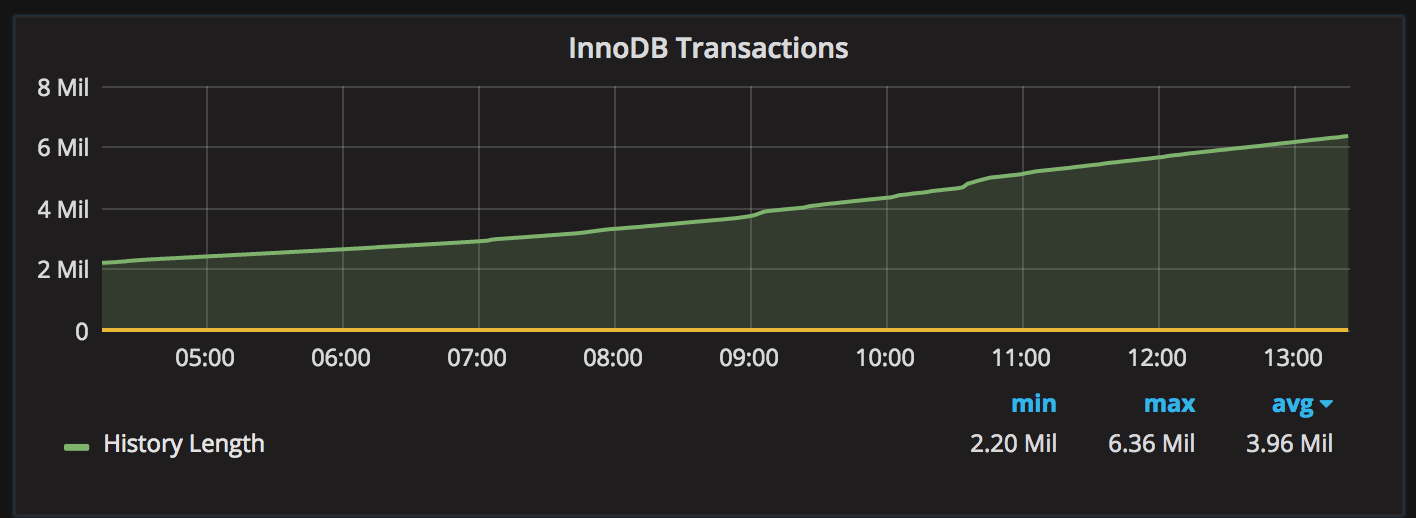
History length of 6 million and growing clearly indicates a problem.
Problem localized
There have been a number of blog posts describing a similar problem: Peter stated in a blog post: “InnoDB transaction history often hides dangerous ‘debt’“. As the InnoDB transaction history grows, SELECTs need to scan more and more previous versions of the rows, and performance suffers. That explains the issue: SELECT queries get slower and slower until restart. Peter also filed this bug: Major regression having many row versions.
But why does the InnoDB transaction history start growing? There are 940 transactions in this state: ACTIVE 766132 sec. MySQL’s process list shows those transactions in “Sleep” state. It turns out that those transactions were “lost” or “hung”. As we can also see, each of those transactions holds two lock structures and one undo record, so they are not committed and not rolled-back. They are sitting there doing nothing. In this case, with the default isolation level REPEATABLE-READ, InnoDB can’t purge the undo records (transaction history) for other transactions until these “hung” transactions are finished.
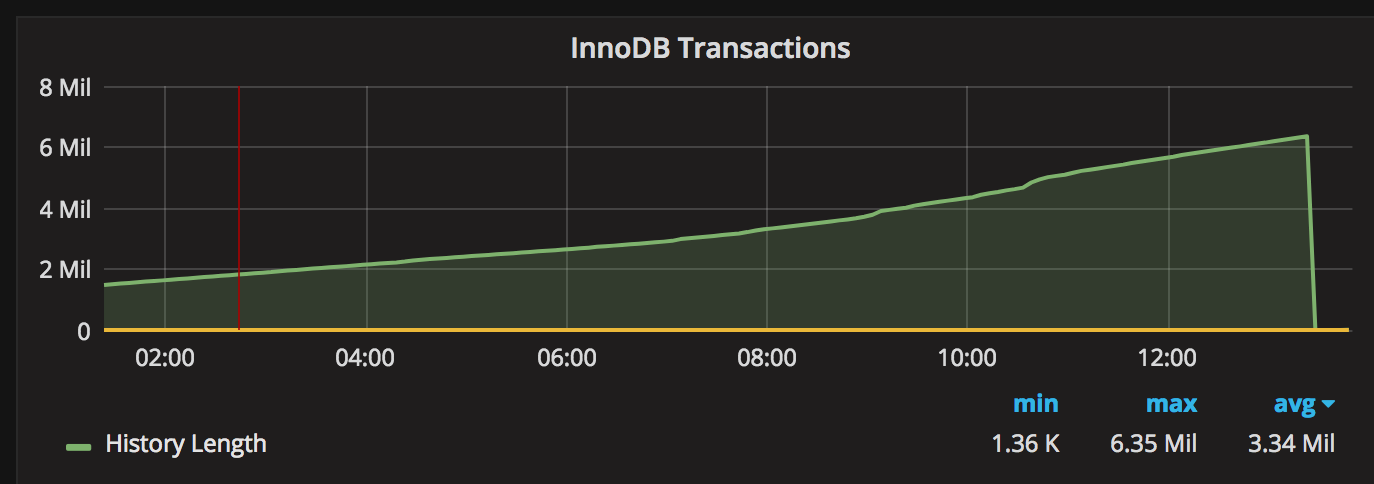
The quick solution is simple: kill those connections and InnoDB will roll back those transactions and purge transaction history. After killing those 940 transactions, the graph looked like this:
However, several questions remain:
As it turns out, it is very easy to simulate this issue with sysbench.
Test preparation
To add some load, I’m using sysbench,16 threads (you can open less, it does not really matter here) and a script for a “write-only” load (running for 120 seconds):
|
1 2 3 4 5 |
conn=" --db-driver=mysql --mysql-host=localhost --mysql-user=user --mysql-password=password --mysql-db=sbtest " sysbench --test=/usr/share/sysbench/tests/include/oltp_legacy/oltp.lua --mysql-table-engine=InnoDB --oltp-table-size=1000000 $conn prepare sysbench --num-threads=16 --max-requests=0 --max-time=120 --test=/usr/share/sysbench/tests/include/oltp_legacy/oltp.lua --oltp-table-size=1000000 $conn --oltp-test-mode=complex --oltp-point-selects=0 --oltp-simple-ranges=0 --oltp-sum-ranges=0 --oltp-order-ranges=0 --oltp-distinct-ranges=0 --oltp-index-updates=1 --oltp-non-index-updates=0 run |
Simulate a “hung” transaction
While the above sysbench is running, open another connection to MySQL:
|
1 2 3 4 5 6 7 8 |
use test; CREATE TABLE `a` ( `i` int(11) DEFAULT NULL ) ENGINE=InnoDB DEFAULT CHARSET=latin1; insert into a values(1); begin; insert into a values(1); select * from a; |
Note: we will need to run the SELECT as a part of this transaction. Do not close the connection.
Watch the history
|
1 2 3 4 5 6 7 8 9 10 11 12 13 14 15 |
mysql> select name, count from information_schema.INNODB_METRICS where name like '%hist%'; +----------------------+-------+ | name | count | +----------------------+-------+ | trx_rseg_history_len | 34324 | +----------------------+-------+ 1 row in set (0.00 sec) mysql> select name, count from information_schema.INNODB_METRICS where name like '%hist%'; +----------------------+-------+ | name | count | +----------------------+-------+ | trx_rseg_history_len | 36480 | +----------------------+-------+ 1 row in set (0.01 sec) |
We can see it is growing. Now it is time to commit or rollback or even kill our original transaction:
|
1 2 3 4 5 6 7 8 9 |
mysql> rollback; ... mysql> select name, count from information_schema.INNODB_METRICS where name like '%hist%'; +----------------------+-------+ | name | count | +----------------------+-------+ | trx_rseg_history_len | 793 | +----------------------+-------+ 1 row in set (0.00 sec) |
As we can see, it has purged the history length.
Finding the queries from the hung transactions
There are a number of options to find the queries from that “hung” transaction. In older MySQL versions, the only way is to enable the general log (or the slow query log). Starting with MySQL 5.6, we can use the Performance Schema. Here are the steps:
|
1 2 3 |
mysql> update performance_schema.setup_consumers set ENABLED = 'YES' where NAME='events_statements_history'; Query OK, 1 row affected (0.00 sec) Rows matched: 1 Changed: 1 Warnings: 0 |
|
1 2 3 4 5 6 7 8 9 10 11 12 13 14 15 16 17 18 19 20 21 22 23 24 25 26 27 28 29 30 31 32 33 34 35 36 37 38 39 40 41 42 43 44 45 46 47 48 49 50 51 52 53 |
SELECT ps.id as processlist_id, trx_started, trx_isolation_level, esh.EVENT_ID, esh.TIMER_WAIT, esh.event_name as EVENT_NAME, esh.sql_text as SQL, esh.RETURNED_SQLSTATE, esh.MYSQL_ERRNO, esh.MESSAGE_TEXT, esh.ERRORS, esh.WARNINGS FROM information_schema.innodb_trx trx JOIN information_schema.processlist ps ON trx.trx_mysql_thread_id = ps.id LEFT JOIN performance_schema.threads th ON th.processlist_id = trx.trx_mysql_thread_id LEFT JOIN performance_schema.events_statements_history esh ON esh.thread_id = th.thread_id WHERE trx.trx_started < CURRENT_TIME - INTERVAL 10 SECOND AND ps.USER != 'SYSTEM_USER' ORDER BY esh.EVENT_IDG ... PROCESS ID: 1971 trx_started: 2017-05-03 17:36:47 trx_isolation_level: REPEATABLE READ EVENT_ID: 79 TIMER_WAIT: 33767000 EVENT NAME: statement/sql/begin SQL: begin RETURNED_SQLSTATE: 00000 MYSQL_ERRNO: 0 MESSAGE_TEXT: NULL ERRORS: 0 WARNINGS: 0 *************************** 9. row *************************** PROCESS ID: 1971 trx_started: 2017-05-03 17:36:47 trx_isolation_level: REPEATABLE READ EVENT_ID: 80 TIMER_WAIT: 2643082000 EVENT NAME: statement/sql/insert SQL: insert into a values(1) RETURNED_SQLSTATE: 00000 MYSQL_ERRNO: 0 MESSAGE_TEXT: NULL ERRORS: 0 WARNINGS: 0 *************************** 10. row *************************** PROCESS ID: 1971 trx_started: 2017-05-03 17:36:47 trx_isolation_level: REPEATABLE READ EVENT_ID: 81 TIMER_WAIT: 140305000 EVENT NAME: statement/sql/select SQL: select * from a RETURNED_SQLSTATE: NULL MYSQL_ERRNO: 0 MESSAGE_TEXT: NULL ERRORS: 0 WARNINGS: 0 |
At this point, we can chase this issue at the application level and find out why this transaction was not committed. The typical causes:
We can also try to configure the timeouts on MySQL or the application so that the connections are closed after “N” minutes.
Changing the transaction isolation level to fix the InnoDB transaction history issue
Now that we know which transaction is holding up the purge process of InnoDB history, we can find this transaction and make changes so it will not “hang”. We can change the transaction isolation level from REPEATABLE READ (default) to READ COMMITTED. In READ COMMITTED, InnoDB does not need to maintain history length when other transactions have committed changes. (More details about different isolation methods and how they affect InnoDB transactions.) That will work in MySQL 5.6 and later. However this doesn’t work in Amazon Aurora (as of now): even with READ COMMITTED isolation level, the history length still grows.
Here is the list of MySQL versions where changing the isolation level fixes the issue
| MySQL Version | Transaction isolation | InnoDB History Length |
| MySQL 5.6 | repeatable read | history is not purged until “hung” transaction finishes |
| MySQL 5.6 | read committed | (fixed) history is purged |
| Aurora | repeatable read | history is not purged until “hung” transaction finishes |
| Aurora | read committed | history is not purged until “hung” transaction finishes |
Summary
Hung transactions can cause the InnoDB history length to grow and (surprisingly, on the first glance) affect the performance of other running select queries. We can use the performance schema to chase the “hung” transaction. Changing the MySQL transaction isolation level can potentially help.


Hi,
Great article, I have been there, luckily I was able to troubleshoot at that time by killing long running transaction.
An observation for readers who might try to simulate this issue by various ways, the Repeatable read txn snapshot is initiated in the lifecycle of the transaction after the first SELECT SQL, i.e. a simple BEGIN; would not block Innodb from purging the history length.
Hi,
Really interesting. Should help to avoid this problems tuning wait_timeout/interactive_timeout? I assume the “hung” sessions were inactive and could be killed after a reasonable amount of time.
Obviously this would not fix the root cause (aka hung sessions) but would stop them from creating more harm.
Thanks
Rubin,
That was really a great article.
I feel there should be a mechanism to identify the dead connections (either from application nor from users) and kill them instantly. So that we can reduce the cost of the impact. what say?
Thanks.
‘@@Neo,
As per my understanding,repeatable read is we can read that data which was available when this transaction started.
Suppose another transaction started and updates that data ,but still you are selecting old version of data because repeatable read isolation. So if we commit this select transaction or kill , then n then it will purge old version data(innodb History for this transaction).
If am correct or wrong please reply…..
Changes in the query response time can mean tons of things. We can check everything from the query plan to the disk performance. However, fixing it with a restart is less common. After looking at “show engine innodb status”, I noticed some strange lines: