

We loaded 990,000 OpenAI embeddings of 1,536 dimensions into six databases that index vectors themselves, built an HNSW index in each, and measured five things: time to a queryable index, storage and memory, recall against throughput, throughput under concurrent clients, and what happens when 10% of the corpus is rewritten. Same host, same container shape, same query set.
The build numbers spread wider than we expected. Time to a queryable index ran from 1.9 minutes to 6.7 hours for the same million vectors. Index size ran from 3.9 GiB to 15.1 GiB, and the engine with the smallest index took the longest to build it. At recall 0.99 the field closes up: MariaDB 12.3, Valkey and pgvector are within a factor of 1.3 of each other. Under 32 clients pgvector returns 21.7× its single-client throughput. We do not report a comparable figure for the three InnoDB-based engines: their multi-client numbers measured a limit in our client, not in the server (see Concurrency).
This is one run on one machine. Multi-client numbers for MariaDB 11.8, MariaDB 12.3 and AliSQL are not reported, and the reason is below. Framework and configuration: github.com/Percona-Lab/vector-bench. Raw records, logs and manifest of this run: release run-full-20260825.
| Host | Intel Xeon Gold 6230 @ 2.10 GHz, 80 logical CPUs, AVX-512, 187.5 GiB RAM |
|---|---|
| Server container | CPUs 0–63, 120.8 GB memory limit, 13 GB /dev/shm |
| Harness container | CPUs 64–79, 8 GB memory limit |
| Corpus | dbpedia-openai-1000k-angular, 990,000 × 1,536 float32, cosine |
| Index | HNSW, M = 16 everywhere, k = 10 |
| Query effort | ann pass sweeps ef_search 10–800, ops pass pins ef_search 100 |
| Concurrency | 1, 2, 4, 8, 16, 32 clients, 60 s per point, 3 repeats |
| Filters | 500 queries per point at 10% and 1% selectivity |
| Churn | 10% of the corpus deleted and re-inserted |
| Build | RelWithDebInfo; -march=x86-64-v3 for MariaDB 11.8, AliSQL and pgvector, -march=native for MariaDB 12.3 |
The database runs in one container and the harness in another, on a private network. One container would charge the several hundred megabytes of NumPy holding the query set to the server’s cgroup and ruin the memory numbers. The harness never configures a server. The orchestrator does, from the same code for every engine, and each engine’s settings are in its server logs beside the results.
Memory went to each engine’s own main cache, so the sizes differ by engine: a 42.3 GB buffer pool for the three InnoDB engines, 72.5 GB of shared_buffers plus 12.1 GB of maintenance_work_mem for pgvector, 108.7 GB of maxmemory for Valkey. Percona Search ran on MongoDB’s default WiredTiger cache, which came to 57–64 GB; the framework did not set it. The three engines with a graph cache, MariaDB 11.8, MariaDB 12.3 and AliSQL, got 30.2 GB of it. All three default to 16 MiB, and leaving that in place would judge a vendor on a value it plainly intends you to change. Index builds got 8 threads; the orchestrator clamped them down from 64, because more than a handful contend rather than help and a large value stalled writes into a populated index outright. It raised /dev/shm from 8 GB to 13 GB so pgvector’s parallel build could hold a segment the size of maintenance_work_mem.
In the recall-against-throughput results, recall is ann-benchmarks’ distance-threshold definition, so those numbers stay comparable with published ANN results. The filtered and churn sections score recall as the overlap with the true top-10 IDs. Ground truth for filtered queries is recomputed by brute force over the rows that satisfy each predicate. A WHERE clause changes the correct answer set, and scoring a filtered query against unfiltered neighbours scores every engine against the wrong targets.
| Engine | Version | Index | Source |
|---|---|---|---|
| MariaDB 11.8 | 11.8.8 | MHNSW | built from tag |
| MariaDB 12.3 | 12.3.2 | MHNSW | built from tag |
| AliSQL | 8.0.44-2 | VIDX | built from tag |
| PostgreSQL + pgvector | pgvector 0.8.6 | HNSW | built from tag |
| Valkey + valkey-search | 9.1.1 | HNSW | Percona packages |
| Percona Search for MongoDB | 1.70.3-1 on PSMDB 8.3.8-2 | HNSW | Percona packages |
Percona Search for MongoDB is a Technical Preview and its documentation says not for production. Its numbers use the scalar-quantized index, which MongoDB recommends above a 3 GB vector index.
| Engine | Load | Index build | To queryable | Rows/s | Index | Table | Peak RSS |
|---|---|---|---|---|---|---|---|
| Percona Search | 14 s | 100 s | 1.9 min | 69,018 | 15.1 GiB | 5.8 GiB | 48.8 GiB |
| Valkey | 33 s | 226 s | 4.3 min | 30,170 | 11.3 GiB | 6.9 GiB | 14.3 GiB |
| PostgreSQL | 26.9 min | 14.0 min | 40.9 min | 613 | 7.6 GiB | 7.6 GiB | 43.5 GiB |
| MariaDB 11.8 | 3.6 h | in the load | 3.6 h | 75.9 | 3.9 GiB | 14.3 GiB | 28.6 GiB |
| MariaDB 12.3 | 5.4 h | in the load | 5.4 h | 50.7 | 3.9 GiB | 14.4 GiB | 27.0 GiB |
| AliSQL | 6.7 h | in the load | 6.7 h | 41.0 | 3.9 GiB | 10.5 GiB | 21.9 GiB |
MHNSW and VIDX update the graph on every INSERT, so their load is the index build and there is nothing separate to time. That puts them at 41 to 76 rows a second against pgvector’s 613 and Valkey’s 30,170. pgvector’s 40.9 minutes is 26.9 minutes of COPY plus 14.0 minutes of parallel build across 8 workers.
They get the smallest index for it: 3.9 GiB, where the raw float32 vectors alone are 5.7 GiB. The index is smaller than the vectors because MHNSW and VIDX keep 16-bit quantized copies of the vectors in the graph, while pgvector and Valkey index full float32. The full-precision vectors stay in the table: MariaDB stores 14.3 GiB there, Percona Search 5.8 GiB. Counting index and table together, AliSQL uses 14.4 GiB, pgvector 15.2, MariaDB 11.8 and Valkey 18.2 each, and Percona Search 20.9. Percona Search’s index measured 15.1 GiB after the load and 7.2 GiB at the start of the churn phase; we do not know which reflects its steady state.
Build time is a re-indexing window. Changing embedding model is an afternoon on pgvector and a weekend on AliSQL.
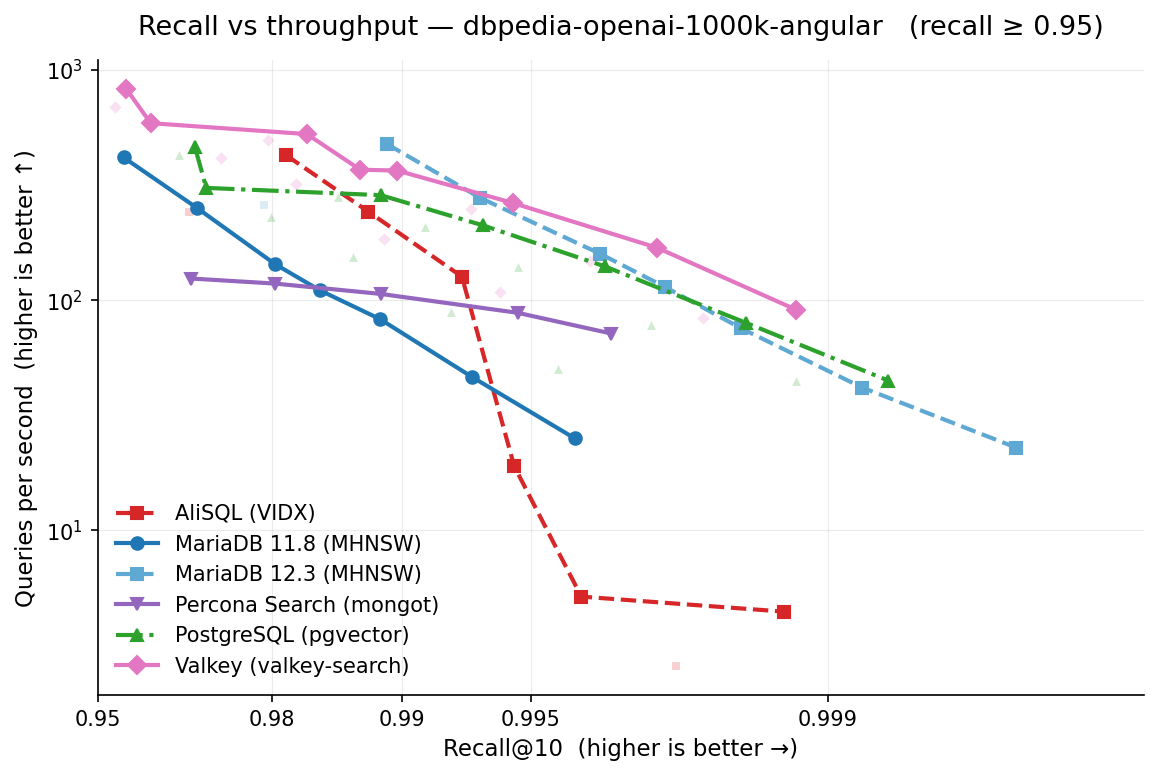
| Engine | recall ≥ 0.90 | ≥ 0.95 | ≥ 0.99 |
|---|---|---|---|
| Valkey | 1,191 | 825 | 264 |
| PostgreSQL | 679 | 462 | 210 |
| MariaDB 12.3 | 475 | 475 | 277 |
| AliSQL | 424 | 424 | 126 |
| MariaDB 11.8 | 415 | 415 | 46 |
| Percona Search | — | — | — |
Best throughput whose measured recall clears each floor. MariaDB and AliSQL repeat a number across two columns because their lowest ef_search setting already returns recall 0.956 to 0.989. It wins both floors. For every MySQL-family engine the ef_search 10 point measured slower than ef_search 20, a warm-up effect the report flags, so their ≥ 0.90 column may be understated. Percona Search shows dashes because the scalar-quantized index used everywhere else in this post peaks at recall 0.892; unquantized, it reaches 138, 124 and 88 QPS at the three floors. The pgvector and Valkey figures come from builds with ef_construction 400; the load table and the other sections use 200 for pgvector and the default for Valkey.
MariaDB 12.3 has the highest throughput at recall 0.99, 277 QPS against Valkey’s 264, a gap one run cannot separate from noise. It is also the one engine built with -march=native rather than x86-64-v3. It gives six times the throughput of 11.8 at that floor for 50% more build time, which is the case for upgrading if accuracy above 0.99 is the target.
Raising the floor from 0.90 to 0.95 costs pgvector and Valkey a third of their throughput. It costs MariaDB and AliSQL nothing, because their lowest ef_search setting is already above both floors. All six have a query-time knob; what MHNSW and VIDX lack is a build-time one. pgvector and Valkey expose ef_construction, and they do not.
One AliSQL point is unexplained. At M = 16, throughput rises from 2.6 to 4.4 QPS between ef_search 400 and 800. More search effort cannot be faster on the same index. AliSQL also has a latency jump at M = 16: p50 is 6.6 ms at ef_search 80, 50.8 ms at 120 and 191 to 384 ms beyond. At M = 6 the jump comes later, between ef_search 200 and 400. The report marks this range as unreliable, so treat these AliSQL points as unmeasured.
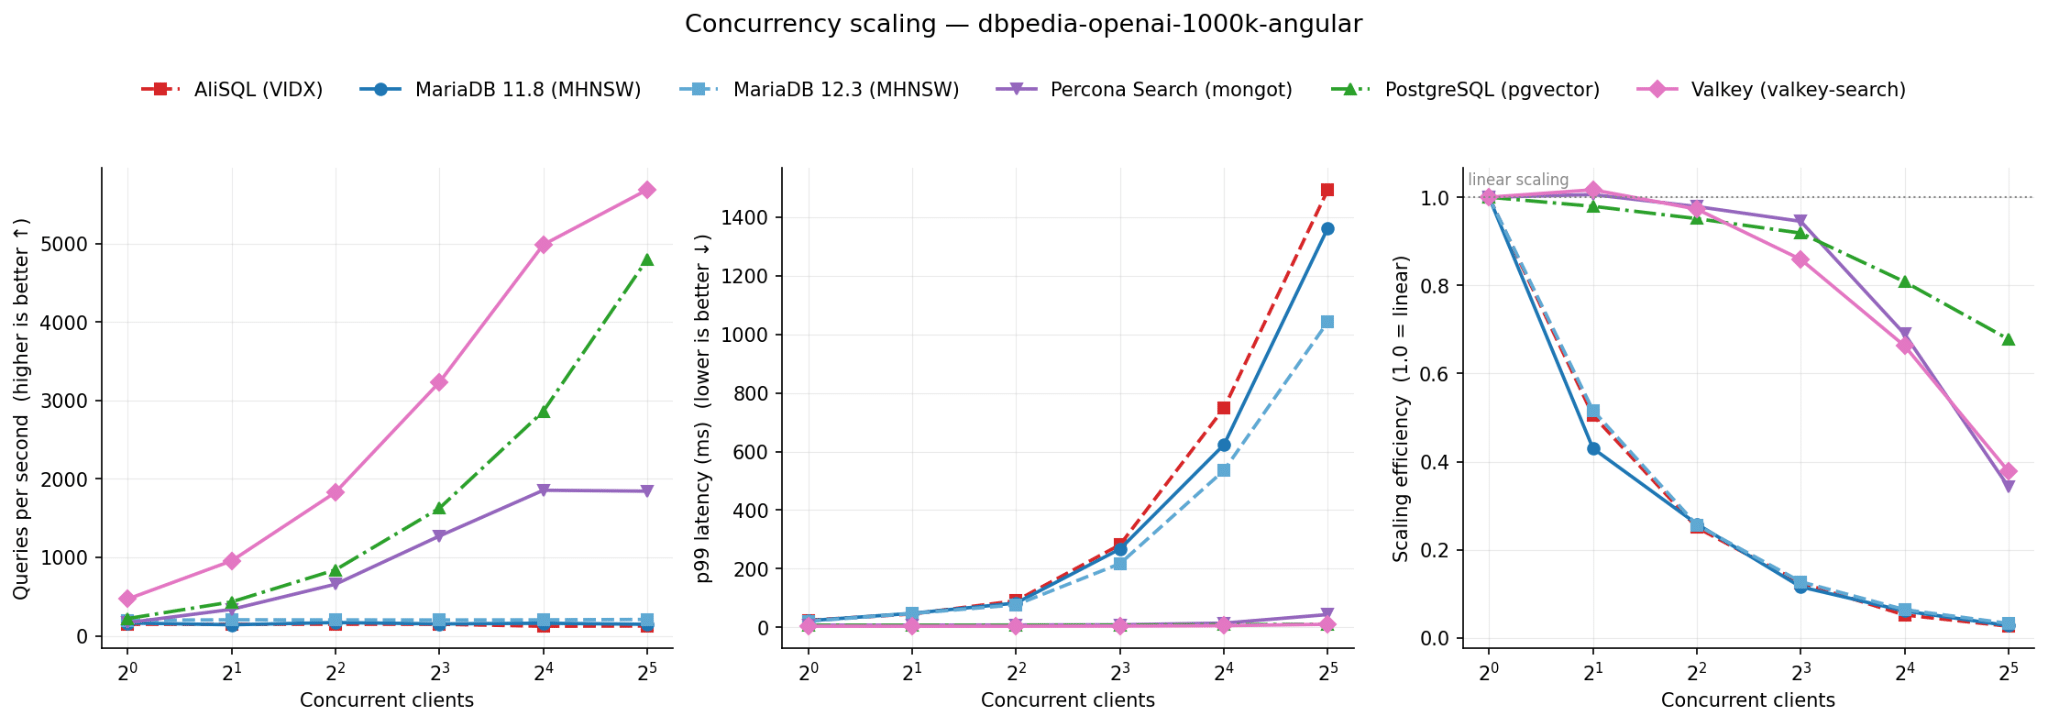
| Engine | 1 | 2 | 4 | 8 | 16 | 32 | p99 @32 | In service @32 |
|---|---|---|---|---|---|---|---|---|
| Valkey | 470 | 956 | 1,829 | 3,230 | 4,983 | 5,683 | 10.2 ms | 30.7 of 32 |
| PostgreSQL | 221 | 433 | 842 | 1,626 | 2,861 | 4,798 | 10.8 ms | 31.9 of 32 |
| Percona Search | 168 | 339 | 659 | 1,272 | 1,856 | 1,844 | 43.5 ms | 28.8 of 32 |
| AliSQL | 148 | — | — | — | — | — | — | — |
| MariaDB 11.8 | 165 | — | — | — | — | — | — | — |
| MariaDB 12.3 | 199 | — | — | — | — | — | — | — |
Dashes are not missing data: the multi-client numbers for these three engines reflect a limit in our benchmark client, explained below, so they are not reported.
“In service” is throughput times median latency. It is a rough estimate of how many queries were in flight, not Little’s law. Little’s law uses mean latency. With a heavy tail the median is far below the mean, so this figure undercounts. For pgvector, Valkey and Percona Search it is close to the client count. For the three MySQL-family engines it is well below it.
Why are these points not reported? Our harness runs its concurrent clients as threads in one Python interpreter, each with its own connection. Their throughput stayed flat from 1 to 32 clients, and they are the three driven through the MariaDB Python connector. The others use psycopg3, PyMongo and a Valkey client.
A later smoke run of ours on the same host shows where that ceiling comes from. On a small corpus, going from 1 to 4 clients, queries in service per client stayed at 0.97 to 0.98 for pgvector, Valkey and Percona Search. For MariaDB 11.8, MariaDB 12.3 and AliSQL it fell from 0.95 to 0.24. That is about one query in flight however many clients ask. A server-side bottleneck would not produce the same ceiling in three separate engines with three separate codebases. A shared client library would.
We have not identified the exact mechanism. The connector releases the interpreter lock while it waits for a query, so the lock is not simply held across the socket wait. Our latency timer also starts in Python before the driver call, so time spent waiting for the interpreter lock is inside the measured latency, and a rise in median latency does not show a queue on the server. We did not profile the server, so we make no claim about how these engines scale under concurrent clients.
The harness now runs each client in its own OS process. This removes the shared interpreter as a cause. It has been tested on synthetic drivers but not yet on these engines. We will publish a re-measurement of the three engines with it rather than estimate the result.
At a single client, every engine spent the whole window inside the timed query call: throughput times mean latency is 1.00 for all six, so there is no measurable harness overhead outside the call. The MySQL-family engines have a heavier tail at one client, a mean of 5.0 to 6.7 ms against a median of 3.7 to 5.1 ms, and their single-client points vary by 22 to 24% between repeats because the first repeat runs cold.
Two limits apply to the multi-client numbers that are reported. Every engine ran at ef_search 100, which gives each engine a different recall, so throughput here is not compared at equal accuracy. And the harness container has 16 CPUs for up to 32 clients: Valkey and Percona Search flatten between 16 and 32 clients, which may be the client running out of CPU rather than the server.
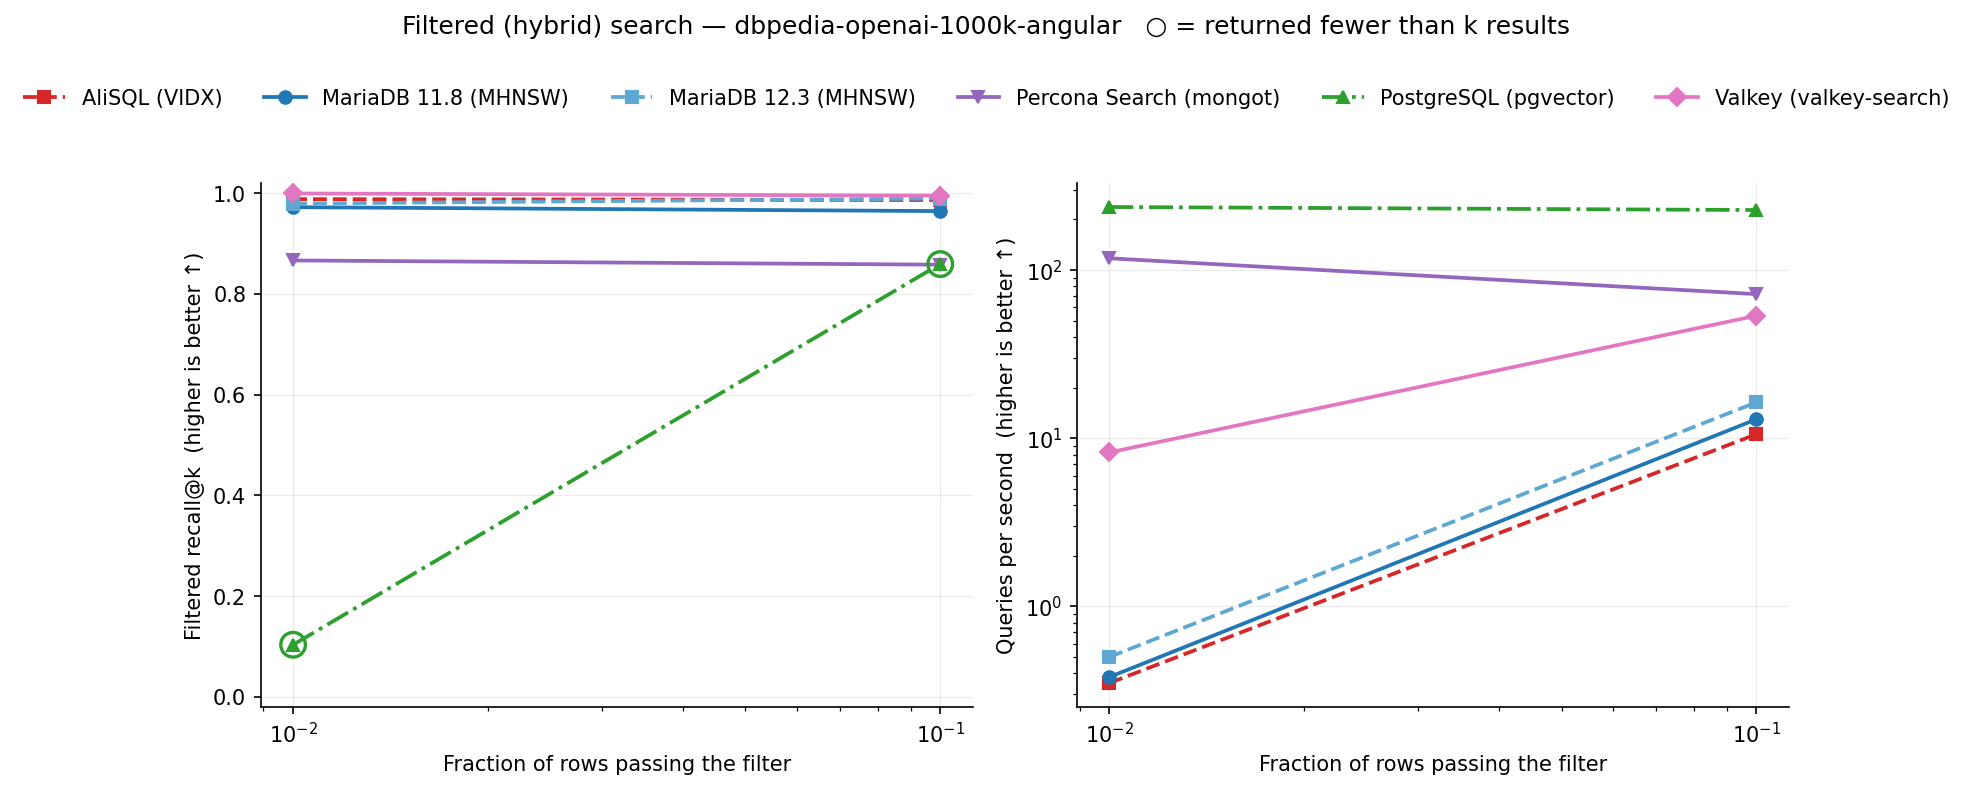
Every engine here answers “nearest neighbours of this vector where a scalar predicate holds”. They do it three different ways, and the ways diverge as the predicate tightens.
| Engine | Strategy | 10% selective | 1% selective | |||
|---|---|---|---|---|---|---|
| Recall | QPS | p99 | Recall | QPS | ||
| Valkey | planned per query | 0.9952 | 53.5 | 36 ms | 0.9996 | 8.2 |
| MariaDB 12.3 | post-filter, keeps going | 0.9896 | 16.4 | 322 ms | 0.9796 | 0.5 |
| AliSQL | post-filter, keeps going | 0.9866 | 10.6 | 447 ms | 0.9884 | 0.3 |
| MariaDB 11.8 | post-filter, keeps going | 0.9646 | 13.0 | 366 ms | 0.9724 | 0.4 |
| Percona Search | pre-filter | 0.8582 | 71.9 | 25 ms | 0.8666 | 117.5 |
| PostgreSQL | post-filter, stops | 0.8594 | 227.5 | 6.4 ms | 0.1034 | 237.1 |
Recall is scored against ground truth recomputed over the qualifying rows only. pgvector’s two recall figures are marked because its queries returned fewer than k rows: 224 of 500 at 10% selectivity, all 500 at 1%.
pgvector post-filters and then stops. It walks the graph, collects ef_search candidates, and drops the ones that fail the predicate. At 1% selectivity nearly all of them fail, so the query returns one or two rows where ten were asked for. No error, no warning, full speed. Recall 0.1034 is a short answer rather than a bad one. Iterative scan exists in pgvector 0.8 for this case and was not measured here, so this is the cost of the default. The default is what an application gets if nobody knows to change it.
MariaDB and AliSQL post-filter too, but keep searching until enough rows survive. Recall holds at 0.96 to 0.99 and throughput goes under one query a second, with a p99 of ten to thirteen seconds.
Percona Search pre-filters, which is why it is the only engine that gets faster as the predicate tightens: 71.9 QPS at 10% selectivity, 117.5 at 1%. Its recall is the lowest of the five that answer completely, 0.858 to 0.867, and that is the scalar quantization rather than the filter. Unquantized it reaches 0.997 on this corpus, at a similar index size. Valkey plans per query and is the only engine that is both accurate and usable at 1%.
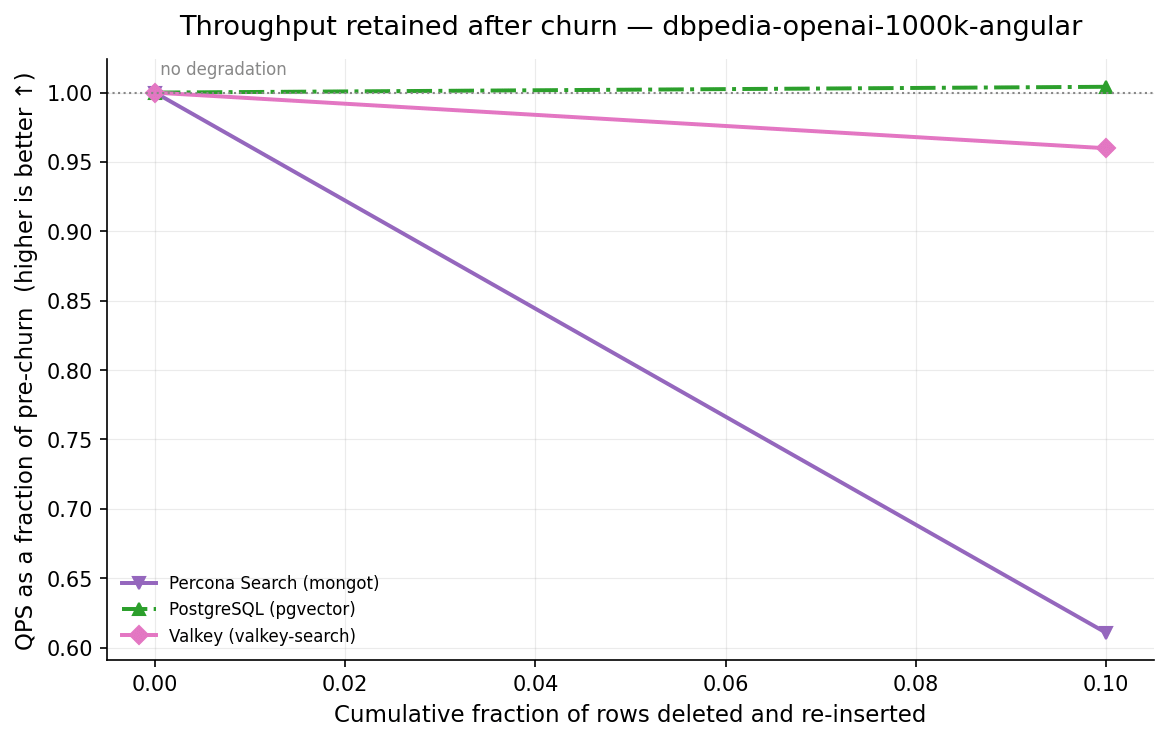
Delete 99,000 rows, re-insert the same 99,000, measure the index again.
| Engine | QPS before | QPS after | Change | Recall after | Re-insert rate |
|---|---|---|---|---|---|
| PostgreSQL | 244 | 245 | +0.4% | 0.9816 | 128 rows/s |
| Valkey | 479 | 460 | −4.0% | 0.9742 | 137 rows/s |
| Percona Search | 186 | 113 | −38.9% | 0.8416 | 20,223 rows/s |
| MariaDB 12.3 | 156 | — | — | — | 28.1 rows/s |
| MariaDB 11.8 | 152 | — | — | — | 22.8 rows/s |
| AliSQL | 138 | — | — | — | 16.1 rows/s |
The three dashes are our bug, not an engine result. Each re-insert gets a wall-clock budget so a stalled write releases the machine instead of holding the run overnight. We set it to thirty minutes, sized against a Valkey defect where pipelined writes into an indexed prefix never returned. Thirty minutes is far too short for an engine doing the work slowly and correctly. MariaDB 12.3 got 51,480 rows of 99,000 in, MariaDB 11.8 got 41,580, AliSQL got 29,700, and the post-churn measurement never ran. The budget is two hours now. Recovering those three cells costs about 24 hours, most of it reloading the corpus.
The partial run still answers part of the question. Re-inserting into a populated index ran at 16 to 28 rows a second, against 41 to 76 for the initial load: 1.8 times slower for MariaDB 12.3, 2.5 for AliSQL and 3.3 for MariaDB 11.8. The two rates are not measured the same way: the load used 8 threads, the re-insert one sequential writer, into a graph that already held 891,000 rows.
Percona Search loses 38.9%, the largest drop in the table, while recall goes 0.8432 to 0.8416. The index is not losing accuracy, the throughput is. Percona Search builds its index asynchronously, so its 20,223 rows/s is the rate at which mongod accepted the writes, not the rate at which the index absorbed them, and the drop may include indexing that was still catching up. Valkey re-inserted at 137 rows/s against 30,170 at load, and we have not explained that gap. pgvector’s throughput did not change.
The run manifest holds the host, the image IDs and the source commit of every engine, and the report generator refuses a run directory without one.
Choosing on this evidence: pgvector if you want a fast index build and throughput that holds through churn; turn on iterative scan before shipping a filtered query, because its default returns short answers at tight selectivity. Valkey if the working set fits in memory and you need filters that are both accurate and fast; test its write path into an indexed prefix first. MariaDB 12.3 or AliSQL if storage matters: their 16-bit index is the smallest here, and MariaDB 12.3 has the highest single-client throughput at recall 0.99. Percona Search if a tight predicate is the common case, since it is the only engine that speeds up as the filter narrows, and if a Technical Preview is acceptable. MariaDB 11.8 loads faster than 12.3 but is six times slower at recall 0.99. AliSQL builds slowest and has an unexplained latency jump above ef_search 80.
This post makes no recommendation based on concurrent throughput. For pgvector, Valkey and Percona Search the multi-client numbers stand. For the three MySQL-family engines we do not have a valid measurement yet.
Where it stops: one corpus at one dimensionality, one graph degree for half the field, one machine, one run, no valid concurrency measurement for the three MySQL-family engines, and no second observation of anything. The numbers most likely to move under a re-run are those concurrency numbers, the three missing churn cells and the AliSQL points above ef_search 80. The least likely are build time, index size and recall, which agreed across earlier runs at two corpus sizes.
|
1 2 3 4 5 6 7 |
git clone https://github.com/Percona-Lab/vector-bench cd vector-bench ./run-benchmark.sh build --engines all ./scripts/generate-dataset.sh dbpedia-openai-1000k-angular ./run-benchmark.sh run --profile tuned-complete --run-id <id> ./run-benchmark.sh report --run-dir <id> \ --datasets dbpedia-openai-1000k-angular |
All runs can take about 40 hours, nearly all of it the incremental builds. Smaller profiles exist for checking the pipeline before committing a machine for two days: --profile dev is about a minute per engine on a synthetic corpus, --profile smoke about 45 minutes per pass and it exercises every chart. The run directory keeps the records, the manifest, per-phase logs and memory timeseries, so any number here traces back to the process that produced it. The run directory behind this post is published as release run-full-20260825. Issues and corrections are welcome.
Run full-20260825, profile tuned-complete, tuned resource pass, dbpedia-openai-1000k-angular, 990,000 × 1,536, M = 16, k = 10. Versions: MariaDB 11.8.8, MariaDB 12.3.2, AliSQL 8.0.44-2, pgvector 0.8.6, Valkey 9.1.1 with valkey-search, Percona Search for MongoDB 1.70.3-1 on PSMDB 8.3.8-2. One run, all of it. Missing measurements are marked missing, not estimated. Charts are the ones the framework generates.
Resources
RELATED POSTS





Updated 1 November 2026. Readers reviewed this benchmark in detail, and we re-verified every figure against the raw data. The multi-client results for MariaDB 11.8, MariaDB 12.3 and AliSQL turned out to measure our benchmark client rather than the servers, so we have set them aside until we re-measure, along with the recommendations that relied on them, and corrected several figures and method descriptions. The full run data is public. Thanks to everyone who dug in: open review is how a benchmark gets better.
Great benchmark writeup, Evgeniy — especially recomputing filtered ground truth strictly over the qualifying rows and separating the three filtered execution behaviors (“post-filter and stop” in pgvector default, “post-filter and keep walking” in MariaDB/AliSQL dropping to 0.3-0.5 QPS at 1% selectivity, and pre-filtering in Percona Search).
One additional selectivity point worth adding between 10% and 1% in vector-bench is 5% selectivity. When we ran a 6-level selectivity sweep (100%, 50%, 10%, 5%, 1%, 0.1%) on OpenSearch 3.9.0 (Lucene 10.5.1 HNSW, m=16, ef_construction=100), 5% selectivity was actually the worst point on the curve (dropping to 216 QPS / 22.3 ms across 40 cores, before recovering at 1% and 0.1% once the filter bitset becomes small enough for Lucene to switch strategies).
By evaluating compact metadata filter predicates prior to distance refinement, we were able to get the same tightening speedup that Percona Search shows here (accelerating from 981 QPS unfiltered to 5,849 QPS at 10% and 6,993 QPS at 5% selectivity at 1.15-1.52 ms) while keeping Recall@10 at 0.93-0.96 and using 4.88 GiB RAM/node instead of 34.1 GiB.
We published our reproducible OpenSearch 3.9 driver script and full selectivity numbers here if useful for comparison: https://massengine.com/benchmarks
Thanks! Very good point on 5%. vector-bench’s tag column is row_id % 100, so we’ll add 0.05 to the selectivity sweep.