
It is a well-known fact in the database world that InnoDB is incredibly fast when the entire database fits into memory. But what happens when your data grows beyond your available RAM?
MyRocks, built on RocksDB, is frequently recommended as a superior choice for environments constrained by memory, thanks to its design for efficient operation with limited resources. This advantage was previously supported by Vadim Tkachenko in his MyRocks Performance blog post. Therefore, our current analysis sought to validate MyRocks’ suitability for such scenarios using the most recent Percona Server for MySQL 8.4.7-7 with MyRocks 9.3.1-3, tested on modern hardware. Specifically, we benchmarked MyRocks against InnoDB in conditions where the database size exceeded available memory, thereby imposing a heavy load on storage I/O.
Our primary goal was to evaluate the scalability of MyRocks versus InnoDB across varying hardware resources. We tested three different VM configurations to observe how each engine adapted to resource constraints:
Using sysbench, we populated a database with 32 tables of 20 million rows each (640 million rows in total). The resulting on-disk database sizes:
As a result, these sizes create a critical distinction in our test scenarios. The database size exceeds available memory (significantly so for the Medium and the Small instance), forcing the engines to rely heavily on storage I/O and testing their efficiency under pressure.
We aimed to identify optimal configurations for MyRocks and InnoDB engines on three distinct hardware profiles and compare their relative performance ratios. Additionally, we maintained ACID compliance throughout the benchmark, with binary logging enabled. The following default settings remained unchanged:
sync_binlog=1innodb_flush_log_at_trx_commit=1rocksdb_flush_log_at_trx_commit=1Before running the benchmarks, we tuned both engines for maximum throughput in this specific environment. In fact, they required very different approaches. For InnoDB, the best performance was achieved using direct I/O for writes:
innodb_flush_method=O_DIRECT (Direct Writes on; default for MySQL/Percona Server 8.4)innodb_buffer_pool_size set to 75% of available memory.In contrast, for MyRocks we found that relying on the OS page cache yielded better results than direct I/O. We kept the default MyRocks page cache options (Direct Reads and Writes off), allowing the page cache to handle the heavy lifting:
rocksdb_use_direct_reads=OFFrocksdb_use_direct_io_for_flush_and_compaction=OFFrocksdb_block_cache_size set to only 1/8 of available memory.The observation that optimal throughput is achieved when rocksdb_block_cache_size is configured at just one-eighth of the available memory suggests that this parameter is not directly equivalent to innodb_buffer_pool_size, indicating that MyRocks’ caching mechanism is less efficient than InnoDB’s buffer pool.
We used three standard Sysbench OLTP scripts to simulate different usage patterns:
oltp_read_only.lua): Standard read-only workload — 14 queries/trx: 10 point selects, 4 range queries (simple, sum, order, distinct).oltp_write_only.lua): Pure data ingestion and modification — 4 queries/trx: 1 index update, 1 non-index update, 1 delete, 1 insert.oltp_read_write.lua): A balanced mix of selects, updates, deletes, and inserts — 18 queries/trx: The 14 read queries from Read Only + the 4 write queries from Write Only.Furthermore, we used the default --rand-type=uniform to maximize memory pressure: unlike a Pareto distribution, where ~80% of accesses hit only ~20% of the data, uniform access spreads queries evenly across all rows — effectively simulating a ~5x larger working set and forcing both engines to contend with the full dataset exceeding available RAM. Detailed command-line options are listed in the appendix.
All benchmarks were executed using Percona Server 8.4.7-7. The results below are presented in Queries Per Second (QPS). We conducted tests across concurrency levels ranging from 8 to 64 threads. In the tables below, cells are color-coded as a heatmap comparing InnoDB and MyRocks directly at each concurrency level: green indicates higher (better) throughput, while red indicates lower throughput.
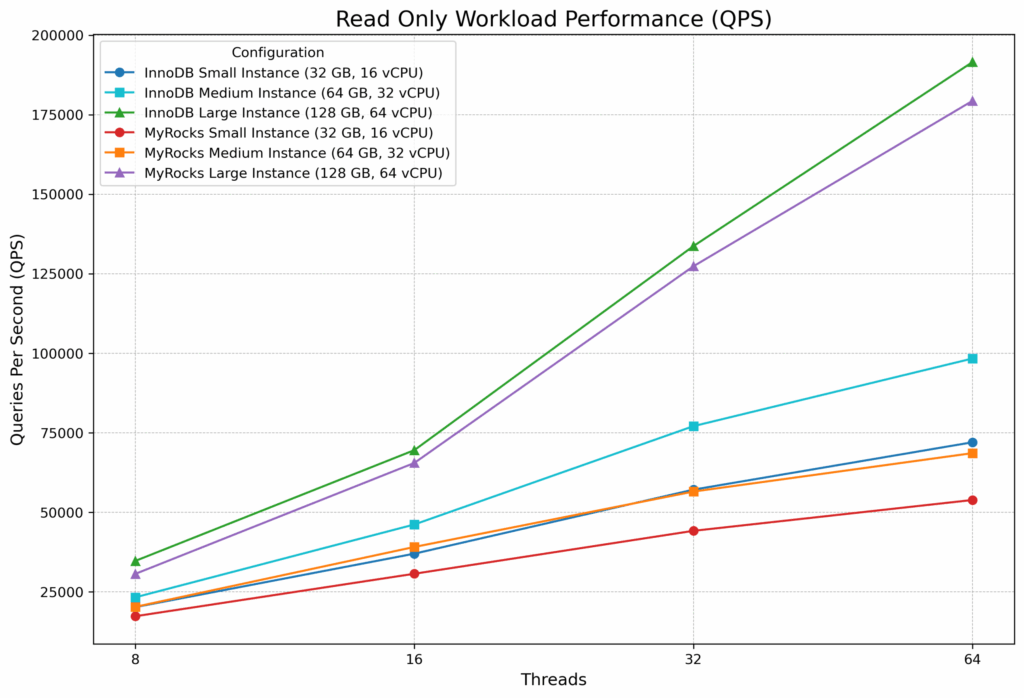
| Configuration for Read Only Workload | 8 thds | 16 thds | 32 thds | 64 thds |
|---|---|---|---|---|
| InnoDB Small Instance (32 GB, 16 vCPU) | 20,157 | 36,956 | 57,088 | 71,989 |
| InnoDB Medium Instance (64 GB, 32 vCPU) | 23,229 | 46,134 | 77,052 | 98,325 |
| InnoDB Large Instance (128 GB, 64 vCPU) | 34,670 | 69,508 | 133,670 | 191,537 |
| MyRocks Small Instance (32 GB, 16 vCPU) | 17,285 | 30,644 | 44,141 | 53,836 |
| MyRocks Medium Instance (64 GB, 32 vCPU) | 20,228 | 39,069 | 56,491 | 68,572 |
| MyRocks Large Instance (128 GB, 64 vCPU) | 30,595 | 65,481 | 127,327 | 179,350 |
InnoDB outperformed MyRocks in the read-only scenario across every configuration, but the margin varied dramatically with instance size. On the Large instance, the gap stayed in single digits — just 5–7% at 32 and 64 threads — where the 128 GB buffer pool could cache a substantial portion of the 161 GB dataset. However, on the more memory-constrained Small and Medium instances, InnoDB’s advantage grew with concurrency, reaching 34% on Small and 43% on Medium at 64 threads. This suggests that InnoDB’s buffer pool management becomes increasingly effective relative to MyRocks’ OS page cache as concurrency rises, but only when memory is tight enough that both engines are fighting for I/O. Conversely, when more memory is available, MyRocks’ compressed 125 GB dataset nearly fits in RAM, closing the gap.
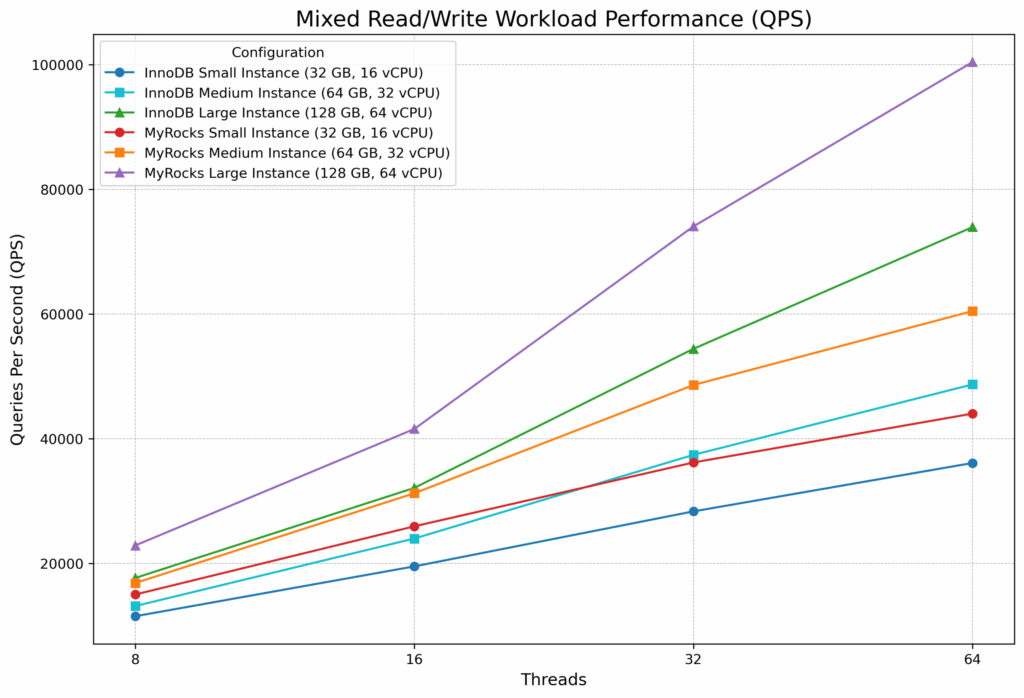
| Configuration for Mixed Read/Write | 8 thds | 16 thds | 32 thds | 64 thds |
|---|---|---|---|---|
| InnoDB Small Instance (32 GB, 16 vCPU) | 11,521 | 19,520 | 28,346 | 36,110 |
| InnoDB Medium Instance (64 GB, 32 vCPU) | 13,156 | 23,991 | 37,414 | 48,714 |
| InnoDB Large Instance (128 GB, 64 vCPU) | 17,664 | 32,113 | 54,424 | 73,957 |
| MyRocks Small Instance (32 GB, 16 vCPU) | 15,008 | 25,950 | 36,192 | 44,031 |
| MyRocks Medium Instance (64 GB, 32 vCPU) | 16,848 | 31,251 | 48,617 | 60,480 |
| MyRocks Large Instance (128 GB, 64 vCPU) | 22,878 | 41,565 | 74,066 | 100,436 |
Once writes entered the picture, the balance shifted decisively in MyRocks’ favor. Specifically, MyRocks outperformed InnoDB by 22–36% across every instance size and concurrency level. The advantage was remarkably consistent: roughly 28–33% on the Small and Medium instances, and 29–36% on the Large instance. Notably, the mixed workload contains 14 read queries and only 4 write queries per transaction, yet the write-side efficiency of MyRocks’ LSM-tree architecture more than compensated for InnoDB’s read-side strengths. Overall, this consistency across hardware profiles indicates that the benefit is structural — rooted in how each engine handles I/O under memory pressure — rather than a quirk of a particular VM size.
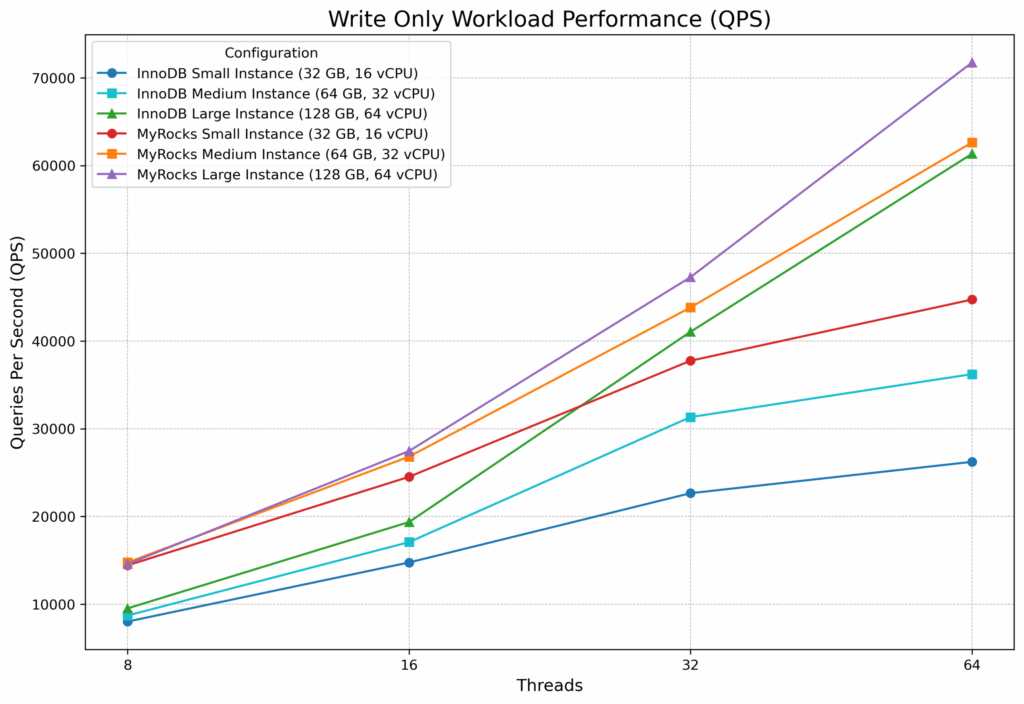
| Configuration for Write Only Workload | 8 thds | 16 thds | 32 thds | 64 thds |
|---|---|---|---|---|
| InnoDB Small Instance (32 GB, 16 vCPU) | 8,019 | 14,752 | 22,649 | 26,225 |
| InnoDB Medium Instance (64 GB, 32 vCPU) | 8,704 | 17,072 | 31,326 | 36,219 |
| InnoDB Large Instance (128 GB, 64 vCPU) | 9,520 | 19,358 | 41,045 | 61,334 |
| MyRocks Small Instance (32 GB, 16 vCPU) | 14,421 | 24,515 | 37,751 | 44,721 |
| MyRocks Medium Instance (64 GB, 32 vCPU) | 14,760 | 26,814 | 43,819 | 62,622 |
| MyRocks Large Instance (128 GB, 64 vCPU) | 14,572 | 27,455 | 47,276 | 71,736 |
The write-only workload produced the most dramatic differences. On the Small instance, MyRocks was 67–80% faster than InnoDB; on the Medium instance, 40–73% faster. Even on the Large instance, MyRocks maintained a 15–53% lead. Furthermore, an interesting pattern emerges in the MyRocks numbers: at 8 threads, write throughput was nearly identical across all three instance sizes (~14,400–14,800 QPS), suggesting that at low concurrency MyRocks’ I/O efficiency — not raw hardware — is the primary performance driver. InnoDB, by contrast, started from a much lower baseline (8,000–9,500 QPS at 8 threads) but scaled more steeply with additional resources, reaching 61,334 QPS on the Large instance at 64 threads — still 15% behind MyRocks’ 71,736 QPS. In summary, the takeaway is clear: when writes dominate and memory is scarce, MyRocks’ LSM-tree design delivers substantially higher throughput, and the advantage is greatest on the smallest, most resource-constrained instances.
1. InnoDB retains a read-only advantage, but the gap depends on available memory. InnoDB was 5–7% faster on the Large instance, where its buffer pool could cache a meaningful portion of the dataset. On memory-constrained Small and Medium instances, InnoDB’s lead grew to 17–43% at higher concurrency — yet even there, InnoDB’s absolute read performance remained lower than what MyRocks achieved on one instance size larger.
2. MyRocks wins mixed workloads convincingly. Across all instance sizes and concurrency levels, MyRocks delivered 22–36% higher throughput than InnoDB in the Mixed Read/Write round. The write-side efficiency more than compensated for InnoDB’s read-side strengths.
3. MyRocks dominates write-heavy workloads. In the Write Only round, MyRocks outperformed InnoDB by 60–80% on the Small and Medium instances and by 15–53% on the Large instance. Its LSM-tree architecture converts random writes into sequential I/O, a decisive advantage when disk access is the bottleneck.
4. Memory constraints amplify MyRocks’ advantage. Across all write-involving workloads, the performance gap between MyRocks and InnoDB was widest on the smallest instances, where the database-to-memory ratio was highest. For example, on the Small instance in the write-only test, MyRocks was up to 80% faster than InnoDB. As available memory increased, InnoDB’s buffer pool could cache more of the working set and partially close the gap — but never enough to overtake MyRocks.
5. MyRocks scales efficiently on modest hardware. Write throughput on MyRocks remained remarkably consistent across instance sizes at low concurrency (~14,400–14,800 QPS at 8 threads regardless of VM size), indicating that its I/O efficiency — not raw hardware — is the primary performance driver. InnoDB, by contrast, needed the Large instance to approach comparable write throughput at high concurrency.
If your workload is predominantly reads and you have sufficient RAM to cache a meaningful portion of your dataset, InnoDB is still the best choice. However, if your application involves significant write activity — especially in environments where the dataset substantially exceeds available memory — MyRocks offers a compelling performance advantage. For mixed workloads in memory-constrained environments, which represent a common real-world scenario, MyRocks delivers consistently higher throughput and should be seriously considered as an alternative to InnoDB.
Beyond raw throughput, MyRocks delivered a 22% smaller on-disk footprint (125 GB vs. 161 GB) thanks to LZ4 compression — a meaningful reduction that compounds across large fleets and translates directly into lower storage costs. Combined with up to 80% higher write throughput under memory pressure and 22–36% higher mixed-workload performance, MyRocks presents a strong case for deployments where datasets are growing faster than memory budgets. Moreover, as DRAM and NAND prices continue to rise — driven in part by surging demand from AI infrastructure — the ability to do more with less memory becomes an increasingly valuable engineering lever. For teams running large InnoDB databases that are hitting I/O bottlenecks or facing prohibitive hardware upgrade costs, MyRocks offers a practical path to better performance without scaling up.
We used a high-performance Supermicro server:
We ran our tests inside KVM virtual machines to simulate realistic cloud/virtualized environments. To isolate performance, we disabled access to the host page cache (driver cache='none') and used a separate 1 TB partition for virtual machines (driver type='raw' io='native'). Furthermore, to maximize stability, we disabled memory ballooning and ensured only one virtual machine was active at any given time.
To ensure transparency and reproducibility, we have made all scripts and configuration files used for these benchmarks available below.
./run-bench-kvm.shWe used the following sysbench workloads with default settings:
|
1 2 3 |
<code>Read Only = "oltp_read_only.lua --skip-trx=off --point-selects=10 --range_selects=on --simple-ranges=1 --sum-ranges=1 --order-ranges=1 --distinct-ranges=1 --rand-type=uniform" Mixed Read Write = "oltp_read_write.lua --skip-trx=off --point-selects=10 --range_selects=on --simple-ranges=1 --sum-ranges=1 --order-ranges=1 --distinct-ranges=1 --index-updates=1 --non-index-updates=1 --delete_inserts=1 --rand-type=uniform" Write Only = "oltp_write_only.lua --skip-trx=off --index-updates=1 --non-index-updates=1 --delete_inserts=1 --rand-type=uniform"</code> |
Resources
RELATED POSTS