In this blog, we will see how to configure Percona Monitoring and Management (PMM) monitoring for a MongoDB cluster. It’s very simple, like adding a replica set or standalone instances to PMM Monitoring.
For this example, I have used docker to create PMM Server and MongoDB sharded cluster containers. If you want the steps I used to create the MongoDB® cluster environment using docker, I have shared them at the end of this blog. You can refer to this if you would like to create the same set up.
For PMM installations, you can check these links for PMM installation and pmm-client setup. The following are the members of the MongoDB cluster:
|
1 |
mongos:<br> mongos1 <br><br>config db: (replSet name - mongors1conf) <br> mongocfg1 <br> mongocfg2 <br> mongocfg3<br><br>Shard1: (replSet name - mongors1) <br> mongors1n1 <br> mongors1n2<br> mongors1n3<br><br>Shard1: (replSet name - mongors2) <br> mongors2n1<br> mongors2n2 <br> mongors2n3 |
In this setup, I installed the pmm-client on mongos1 server. Then I added an agent to monitor MongoDB metrics with cluster option as shown in the next code block. I named the cluster “mongoClusterPMM” (Note: you have to be root user or need sudo access to execute the pmm-admin command):
|
1 |
root@90262f1360a0:/# pmm-admin add mongodb --cluster mongoClusterPMM<br>[linux:metrics] OK, now monitoring this system.<br>[mongodb:metrics] OK, now monitoring MongoDB metrics using URI localhost:27017<br>[mongodb:queries] OK, now monitoring MongoDB queries using URI localhost:27017<br>[mongodb:queries] It is required for correct operation that profiling of monitored MongoDB databases be enabled.<br>[mongodb:queries] Note that profiling is not enabled by default because it may reduce the performance of your MongoDB server.<br>[mongodb:queries] For more information read PMM documentation (https://www.percona.com/doc/percona-monitoring-and-management/conf-mongodb.html).<br><br>root@90262f1360a0:/# pmm-admin list<br>pmm-admin 1.11.0<br>PMM Server | 172.17.0.2 (password-protected)<br>Client Name | 90262f1360a0<br>Client Address | 172.17.0.4 <br>Service Manager | unix-systemv<br>---------------- ------------- ----------- -------- ---------------- ------------------------<br>SERVICE TYPE NAME LOCAL PORT RUNNING DATA SOURCE OPTIONS <br>---------------- ------------- ----------- -------- ---------------- ------------------------<br>mongodb:queries 90262f1360a0 - YES localhost:27017 query_examples=true <br>linux:metrics 90262f1360a0 42000 YES - <br>mongodb:metrics 90262f1360a0 42003 YES localhost:27017 cluster=mongoClusterPMM <br>root@90262f1360a0:/# |
As you can see, I used the pmm-admin add mongodb [options] command which enables monitoring for system, MongoDB metrics and queries. You need to enable profiler to monitor MongoDB queries. Use the next command to enable it at database level:
|
1 |
use db_name<br>db.setProfilingLevel(1) |
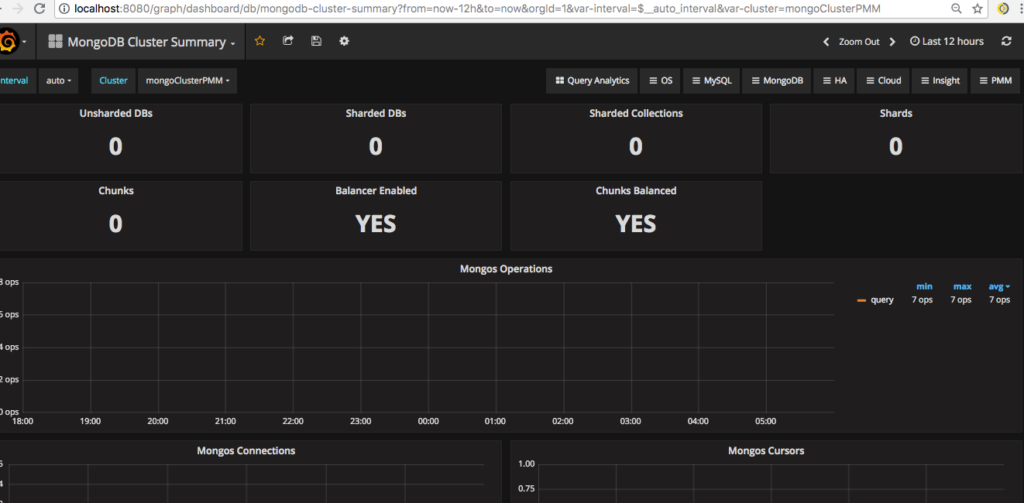
Check this blog to know more about QAN setup and details. If you want to enable only MongoDB metrics, rather than queries to be monitored, then you can use the command pmm-admin add mongodb:metrics [options] . After this, go to the PMM homepage (in my case localhost:8080) in your browser and select MongoDB Cluster Summary from the drop down list under the MongoDB option. The below screenshot shows the MongoDB Cluster—”mongoClusterPMM” statistics— collected by the agent that we added in mongos1 server.

Did we miss something here? And do you see any metrics in the dashboard above except “Balancer Enabled” and “Chunks Balanced”?
No. This is because, PMM doesn’t have enough data to show in the dashboard. The shards are not added to the cluster yet and as you can see it displays 0 under shards. Let’s add two shard replica sets mongors1 and mongors2 in the mongos1 instance, and enable sharding to the database to complete the cluster setup as follows:
|
1 |
mongos> sh.addShard("mongors1/mongors1n1:27017,mongors1n2:27017,mongors1n3:27017")<br>{ "shardAdded" : "mongors1", "ok" : 1 }<br>mongos> sh.addShard("mongors2/mongors2n1:27017,mongors2n2:27017,mongors2n3:27017")<br>{ "shardAdded" : "mongors2", "ok" : 1 } |
Now, I’ll add some data, collection and shard keys, and enable sharding so that we can see some statistics in the dashboard:
|
1 |
use vinodh<br>db.setProfilingLevel(1)<br>db.testColl.insertMany([{id1:1,name:"test insert"},{id1:2,name:"test insert"},{id1:3,name:"insert"},{id1:4,name:"insert"}])<br>db.testColl.ensureIndex({id1:1})<br><br>sh.enableSharding("vinodh")<br>sh.shardCollection("vinodh.testColl", {id1:1}) |
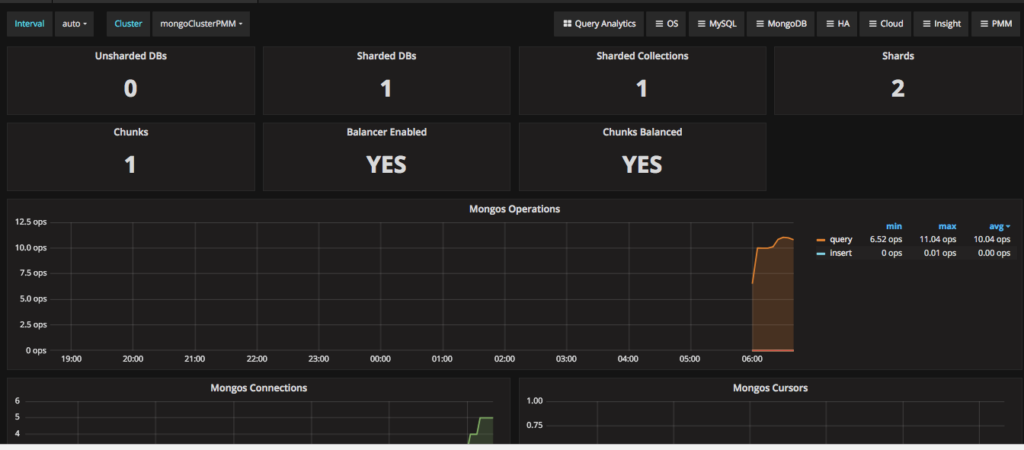
At last! Now you can see statistics in the graph for the MongoDB cluster:

We are not done yet. We have just added an agent to monitor mongos1 instance, and so only the cluster related statistics and QAN are collected through this node. For monitoring all nodes in the MongoDB cluster, we need to configure all nodes in PMM under “mongoClusterPMM” cluster. This will tell PMM that the configured nodes are part of the same cluster. We could also monitor the replica set related metrics for the members in config DBs and shards. Let’s add the monitoring agents in mongos1 server to monitor all MongoDB instances remotely. We’ll use these commands:
|
1 |
pmm-admin add mongodb:metrics --uri "mongodb://mongocfg1:27017/admin?replicaSet=mongors1conf" mongocfg1replSet --cluster mongoClusterPMM<br>pmm-admin add mongodb:metrics --uri "mongodb://mongocfg2:27017/admin?replicaSet=mongors1conf" mongocfg2replSet --cluster mongoClusterPMM<br>pmm-admin add mongodb:metrics --uri "mongodb://mongocfg3:27017/admin?replicaSet=mongors1conf" mongocfg3replSet --cluster mongoClusterPMM<br>pmm-admin add mongodb:metrics --uri "mongodb://mongors1n1:27017/admin?replicaSet=mongors1" mongors1replSetn1 --cluster mongoClusterPMM<br>pmm-admin add mongodb:metrics --uri "mongodb://mongors1n2:27017/admin?replicaSet=mongors1" mongors1replSetn2 --cluster mongoClusterPMM<br>pmm-admin add mongodb:metrics --uri "mongodb://mongors1n3:27017/admin?replicaSet=mongors1" mongors1replSetn3 --cluster mongoClusterPMM<br>pmm-admin add mongodb:metrics --uri "mongodb://mongors2n1:27017/admin?replicaSet=mongors2" mongors2replSetn1 --cluster mongoClusterPMM<br>pmm-admin add mongodb:metrics --uri "mongodb://mongors2n2:27017/admin?replicaSet=mongors2" mongors2replSetn2 --cluster mongoClusterPMM<br>pmm-admin add mongodb:metrics --uri "mongodb://mongors2n3:27017/admin?replicaSet=mongors2" mongors2replSetn3 --cluster mongoClusterPMM |
Once you have added them, you can check the agent’s (mongodb-exporter) status as follows:
|
1 |
root@90262f1360a0:/# pmm-admin list<br>pmm-admin 1.11.0<br>PMM Server | 172.17.0.2 (password-protected)<br>Client Name | 90262f1360a0<br>Client Address | 172.17.0.4 <br>Service Manager | unix-systemv<br><br>---------------- ------------------ ----------- -------- ----------------------- ------------------------<br>SERVICE TYPE NAME LOCAL PORT RUNNING DATA SOURCE OPTIONS <br>---------------- ------------------ ----------- -------- ----------------------- ------------------------<br>mongodb:queries 90262f1360a0 - YES localhost:27017 query_examples=true <br>linux:metrics 90262f1360a0 42000 YES - <br>mongodb:metrics 90262f1360a0 42003 YES localhost:27017 cluster=mongoClusterPMM <br>mongodb:metrics mongocfg1replSet 42004 YES mongocfg1:27017/admin cluster=mongoClusterPMM <br>mongodb:metrics mongocfg2replSet 42005 YES mongocfg2:27017/admin cluster=mongoClusterPMM <br>mongodb:metrics mongocfg3replSet 42006 YES mongocfg3:27017/admin cluster=mongoClusterPMM <br>mongodb:metrics mongors1replSetn1 42007 YES mongors1n1:27017/admin cluster=mongoClusterPMM <br>mongodb:metrics mongors1replSetn3 42008 YES mongors1n3:27017/admin cluster=mongoClusterPMM <br>mongodb:metrics mongors2replSetn1 42009 YES mongors2n1:27017/admin cluster=mongoClusterPMM <br>mongodb:metrics mongors2replSetn2 42010 YES mongors2n2:27017/admin cluster=mongoClusterPMM <br>mongodb:metrics mongors2replSetn3 42011 YES mongors2n3:27017/admin cluster=mongoClusterPMM <br>mongodb:metrics mongors1replSetn2 42012 YES mongors1n2:27017/admin cluster=mongoClusterPMM |
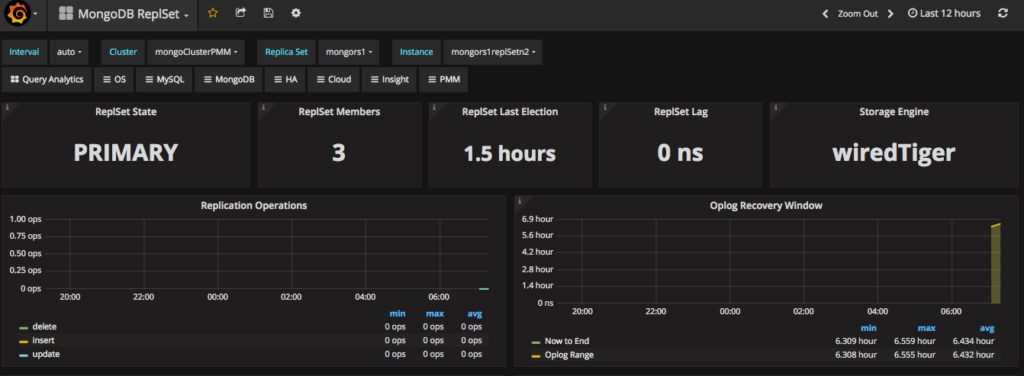
So now you can monitor every member of the MongoDB cluster including their replica set and shard statistics. The next screenshot shows one of the members from the replica set under MongoDB replica set dashboard. You can select this from dashboard in this way: Cluster: mongoClusterPMM → Replica Set: mongors1 → Instance: mongors1replSetn2]:

As I said in the beginning of this blog, I’ve provided the steps for the MongoDB cluster setup. Since this is for testing, I have used very simple configuration to setup the cluster environment using docker-compose. Before creating the MongoDB cluster, create the network in docker for the cluster nodes and PMM to connect each other like this:
|
1 |
Vinodhs-MBP:docker-mcluster vinodhkrish$ docker network create mongo-cluster-nw<br>7e3203aed630fed9b5f5f2b30e346301a58a068dc5f5bc0bfe38e2eef1d48787 |
I used the docker-compose.yaml file to create the docker environment here:
|
1 |
version: '2'<br>services:<br> mongors1n1:<br> container_name: mongors1n1<br> image: mongo:3.4<br> command: mongod --shardsvr --replSet mongors1 --dbpath /data/db --port 27017<br> networks:<br> - mongo-cluster<br> ports:<br> - 27047:27017<br> expose:<br> - "27017"<br> environment:<br> TERM: xterm<br> mongors1n2:<br> container_name: mongors1n2<br> image: mongo:3.4<br> command: mongod --shardsvr --replSet mongors1 --dbpath /data/db --port 27017<br> networks:<br> - mongo-cluster<br> ports:<br> - 27048:27017<br> expose:<br> - "27017"<br> environment:<br> TERM: xterm<br> mongors1n3:<br> container_name: mongors1n3<br> image: mongo:3.4<br> command: mongod --shardsvr --replSet mongors1 --dbpath /data/db --port 27017<br> networks:<br> - mongo-cluster<br> ports:<br> - 27049:27017<br> expose:<br> - "27017"<br> environment:<br> TERM: xterm<br> mongors2n1:<br> container_name: mongors2n1<br> image: mongo:3.4<br> command: mongod --shardsvr --replSet mongors2 --dbpath /data/db --port 27017<br> networks:<br> - mongo-cluster<br> ports:<br> - 27057:27017<br> expose:<br> - "27017"<br> environment:<br> TERM: xterm<br> mongors2n2:<br> container_name: mongors2n2<br> image: mongo:3.4<br> command: mongod --shardsvr --replSet mongors2 --dbpath /data/db --port 27017<br> networks:<br> - mongo-cluster<br> ports:<br> - 27058:27017<br> expose:<br> - "27017"<br> environment:<br> TERM: xterm<br> mongors2n3:<br> container_name: mongors2n3<br> image: mongo:3.4<br> command: mongod --shardsvr --replSet mongors2 --dbpath /data/db --port 27017<br> networks:<br> - mongo-cluster<br> ports:<br> - 27059:27017<br> expose:<br> - "27017"<br> environment:<br> TERM: xterm<br> mongocfg1:<br> container_name: mongocfg1<br> image: mongo:3.4<br> command: mongod --configsvr --replSet mongors1conf --dbpath /data/db --port 27017<br> networks:<br> - mongo-cluster<br> ports:<br> - 27025:27017<br> environment:<br> TERM: xterm<br> expose:<br> - "27017"<br> mongocfg2:<br> container_name: mongocfg2<br> image: mongo:3.4<br> command: mongod --configsvr --replSet mongors1conf --dbpath /data/db --port 27017<br> networks:<br> - mongo-cluster<br> ports:<br> - 27024:27017<br> environment:<br> TERM: xterm<br> expose:<br> - "27017"<br> mongocfg3:<br> container_name: mongocfg3<br> image: mongo:3.4<br> command: mongod --configsvr --replSet mongors1conf --dbpath /data/db --port 27017<br> networks:<br> - mongo-cluster<br> ports:<br> - 27023:27017<br> environment:<br> TERM: xterm<br> expose:<br> - "27017"<br> mongos1:<br> container_name: mongos1<br> image: mongo:3.4<br> depends_on:<br> - mongocfg1<br> - mongocfg2<br> command: mongos --configdb mongors1conf/mongocfg1:27017,mongocfg2:27017,mongocfg3:27017 --port 27017<br> networks:<br> - mongo-cluster<br> ports:<br> - 27019:27017<br> expose:<br> - "27017"<br>networks:<br> mongo-cluster:<br> external:<br> name: mongo-cluster-nw |
Hint:
In the docker compose file, above, if you are using docker-compose version >=3.x, then you can use the option for “networks” in the yaml file like this:
|
1 |
networks:<br> mongo-cluster:<br> name: mongo-cluster-nw |
Now start the containers and configure the cluster quickly as follows:
|
1 |
Vinodhs-MBP:docker-mcluster vinodhkrish$ docker-compose up -d<br>Creating mongocfg1 ... <br>Creating mongos1 ... <br>Creating mongors2n3 ... <br>Creating mongocfg2 ... <br>Creating mongors1n1 ... <br>Creating mongocfg3 ... <br>Creating mongors2n2 ... <br>Creating mongors1n3 ... <br>Creating mongors2n1 ... <br>Creating mongors1n2 ... |
|
1 |
Vinodhs-MBP:docker-mcluster vinodhkrish$ docker exec -it mongocfg1 mongo --quiet<br>> rs.initiate({ _id: "mongors1conf",configsvr: true,<br>... members: [{ _id:0, host: "mongocfg1" },{_id:1, host: "mongocfg2" },{ _id:2, host: "mongocfg3"}]<br>... })<br>{ "ok" : 1 } |
|
1 |
Vinodhs-MBP:docker-mcluster vinodhkrish$ docker exec -it mongors1n1 mongo --quiet<br>> rs.initiate( { _id: "mongors1", members:[ {_id: 0, host: "mongors1n1"}, {_id:1, host: "mongors1n2"}, {_id:2, host: "mongors1n3"}] })<br>{ "ok" : 1 } |
|
1 |
Vinodhs-MBP:docker-mcluster vinodhkrish$ docker exec -it mongors2n1 mongo --quiet<br>> rs.initiate({ _id: "mongors2", members: [ { _id: 0, host: "mongors2n1"}, { _id:1, host: "mongors2n2"}, { _id:2, host: "mongors2n3"}] })<br>{ "ok" : 1 } |
I hope that this blog helps you to setup a MongoDB cluster and also to configure PMM to monitor it! Have a great day!
Resources
RELATED POSTS