
I heard a frequent question at last week’s Percona Live conference regarding Percona Monitoring and Management (PMM): How much disk space should I allocate for PMM Server?
First, let’s review the three components of Percona Monitoring and Management that consume non-negligible disk space:
Of these, you’ll find that Prometheus is generally your largest consumer of disk space. Prometheus hits a steady state of disk utilization once you reach the defined storage.local.retention period. If you deploy Percona Monitoring and Management 1.1.3 (the latest stable version), you’ll be using a retention period of 30 days. “Steady state” in this case means you’re not adding or removing nodes frequently, since each node comes with its own 1k-7k metrics to be scraped. Prometheus stores a one-time series per metric scraped, and automatically trims chunks (like InnoDB pages) from the tail of the time series once they exceed the retention period (so the disk requirement per static list of metrics remains “fixed” for the retention period).
However, if you’re in a dynamic environment with nodes being added and removed frequently, or you’re on the extreme end like these guys who re-deploy data centers every day, steady state for Prometheus may remain an elusive goal. The guidance you find below may help you establish at least a minimum disk provisioning threshold.
QAN is based on a web application and uses Percona Server 5.7.17 as it’s datastore. The Percona QAN agent runs one instance per monitored MySQL server, and obtains queries from either the Slow log or Performance Schema. It performs analysis locally to generate a list of unique queries and their corresponding metrics: min, max, avg, med, and p95. There are dimensions based on Tmp table, InnoDB, Query time, Lock time, etc. Check the schema for a full listing, as there are actually 149 columns on this table (show create table pmm.query_class_metricsG). While the table is wide, it isn’t too long: PMM Demo is ~9mil rows and is approximately 1 row per distinct query per minute per host.
Finally, there is Orchestrator. While the disk requirements for Orchestrator are not zero, they are certainly dwarfed by Prometheus and QAN. As you’ll read below, Percona’s Orchestrator footprint is a measly ~250MB, which is a rounding error. I’d love to hear other experiences with Orchestrator and how large your InnoDB footprint is for a large or active cluster.
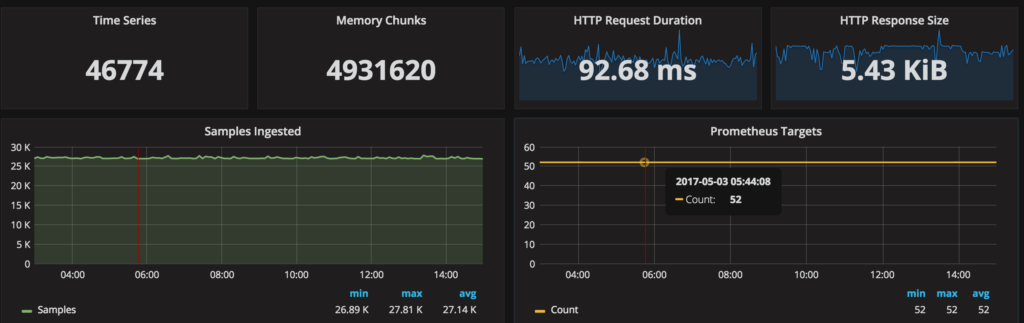
For comparison, here is the resource consumption from Percona’s PMM Demo site:
So back to the original question: How much space should I allocate for Percona Monitoring and Management Server? The favorite answer at Percona is “It Depends®,” and this case is no different. Using PMM Demo as our basis, 46GB / 25 hosts / 8 days = ~230MB/host/day or ~6.9GB/host/30 day retention period. For those of you running 50 instances in PMM, you should be provisioning ~400GB of disk.
Of course, your environment is likely to be different and directly related to what you do and don’t enable. For example, a fully verbose Percona Server 5.7.17 configuration file like this:
|
1 2 3 4 5 6 7 8 9 10 11 12 13 |
## PMM Enhanced options long_query_time=0 log_slow_rate_limit=100 log_slow_rate_type=query log_slow_verbosity=full log_slow_admin_statements=ON log_slow_slave_statements=ON slow_query_log_always_write_time=1 slow_query_log_use_global_control=all innodb_monitor_enable=all userstat=1 query_response_time_stats=ON performance_schema_instrument='%=on' |
with none of the mysqld_exporter features disabled:
|
1 2 3 4 5 |
--disable-binlogstats --disable-processlist --disable-queryexamples --disable-tablestats --disable-userstats |
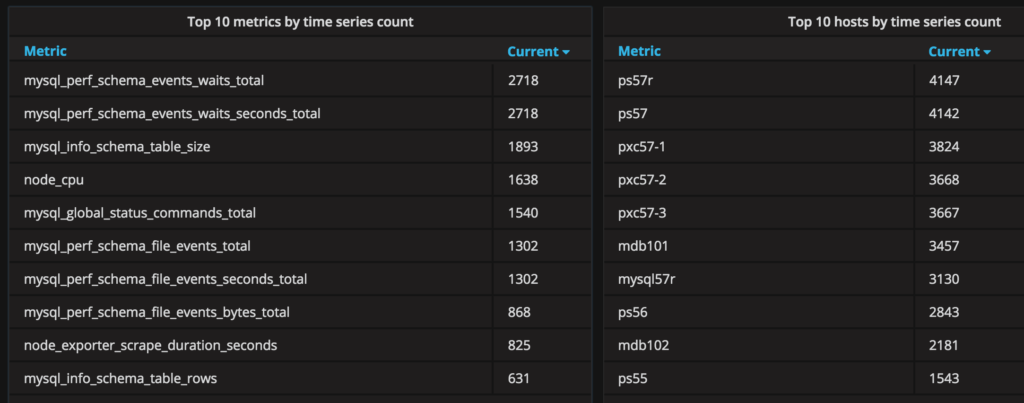
can lead to an instance that has +4k metrics and will push you above 230MB/host/day. This is what the top ten metrics and hosts by time series count from the PMM Demo look like:
What does the future hold related to minimizing disk space consumption?
I’d love to hear about your own experiences using Percona Monitoring and Management, and specifically the disk requirements you’ve faced! Please share them with us via the comments below, or feel free to drop me a line directly [email protected]. Thanks for reading!


