
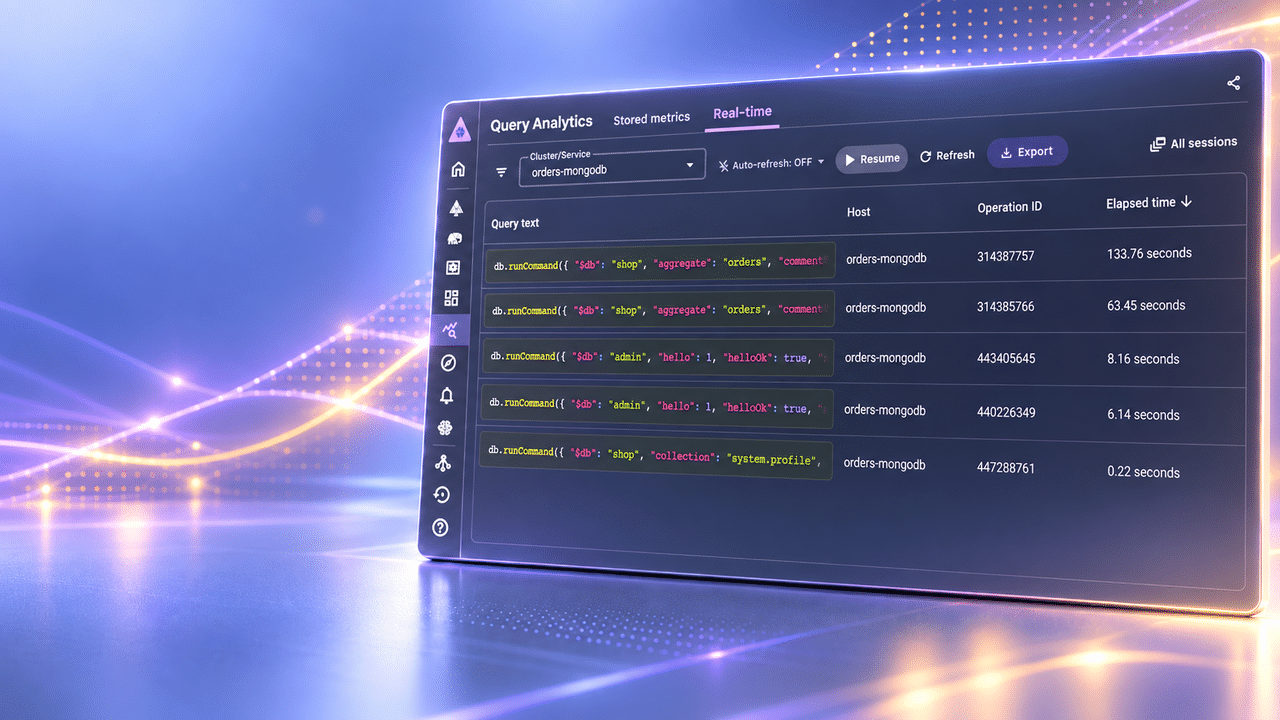
The application is slow, the Slack channel is on fire, and somebody asks the oldest question in our job: What is running on the database right now? Query Analytics (QAN) in PMM is great for the history. It shows which queries used the most time in the last hour or the last 12 hours. This is QAN from my test environment: 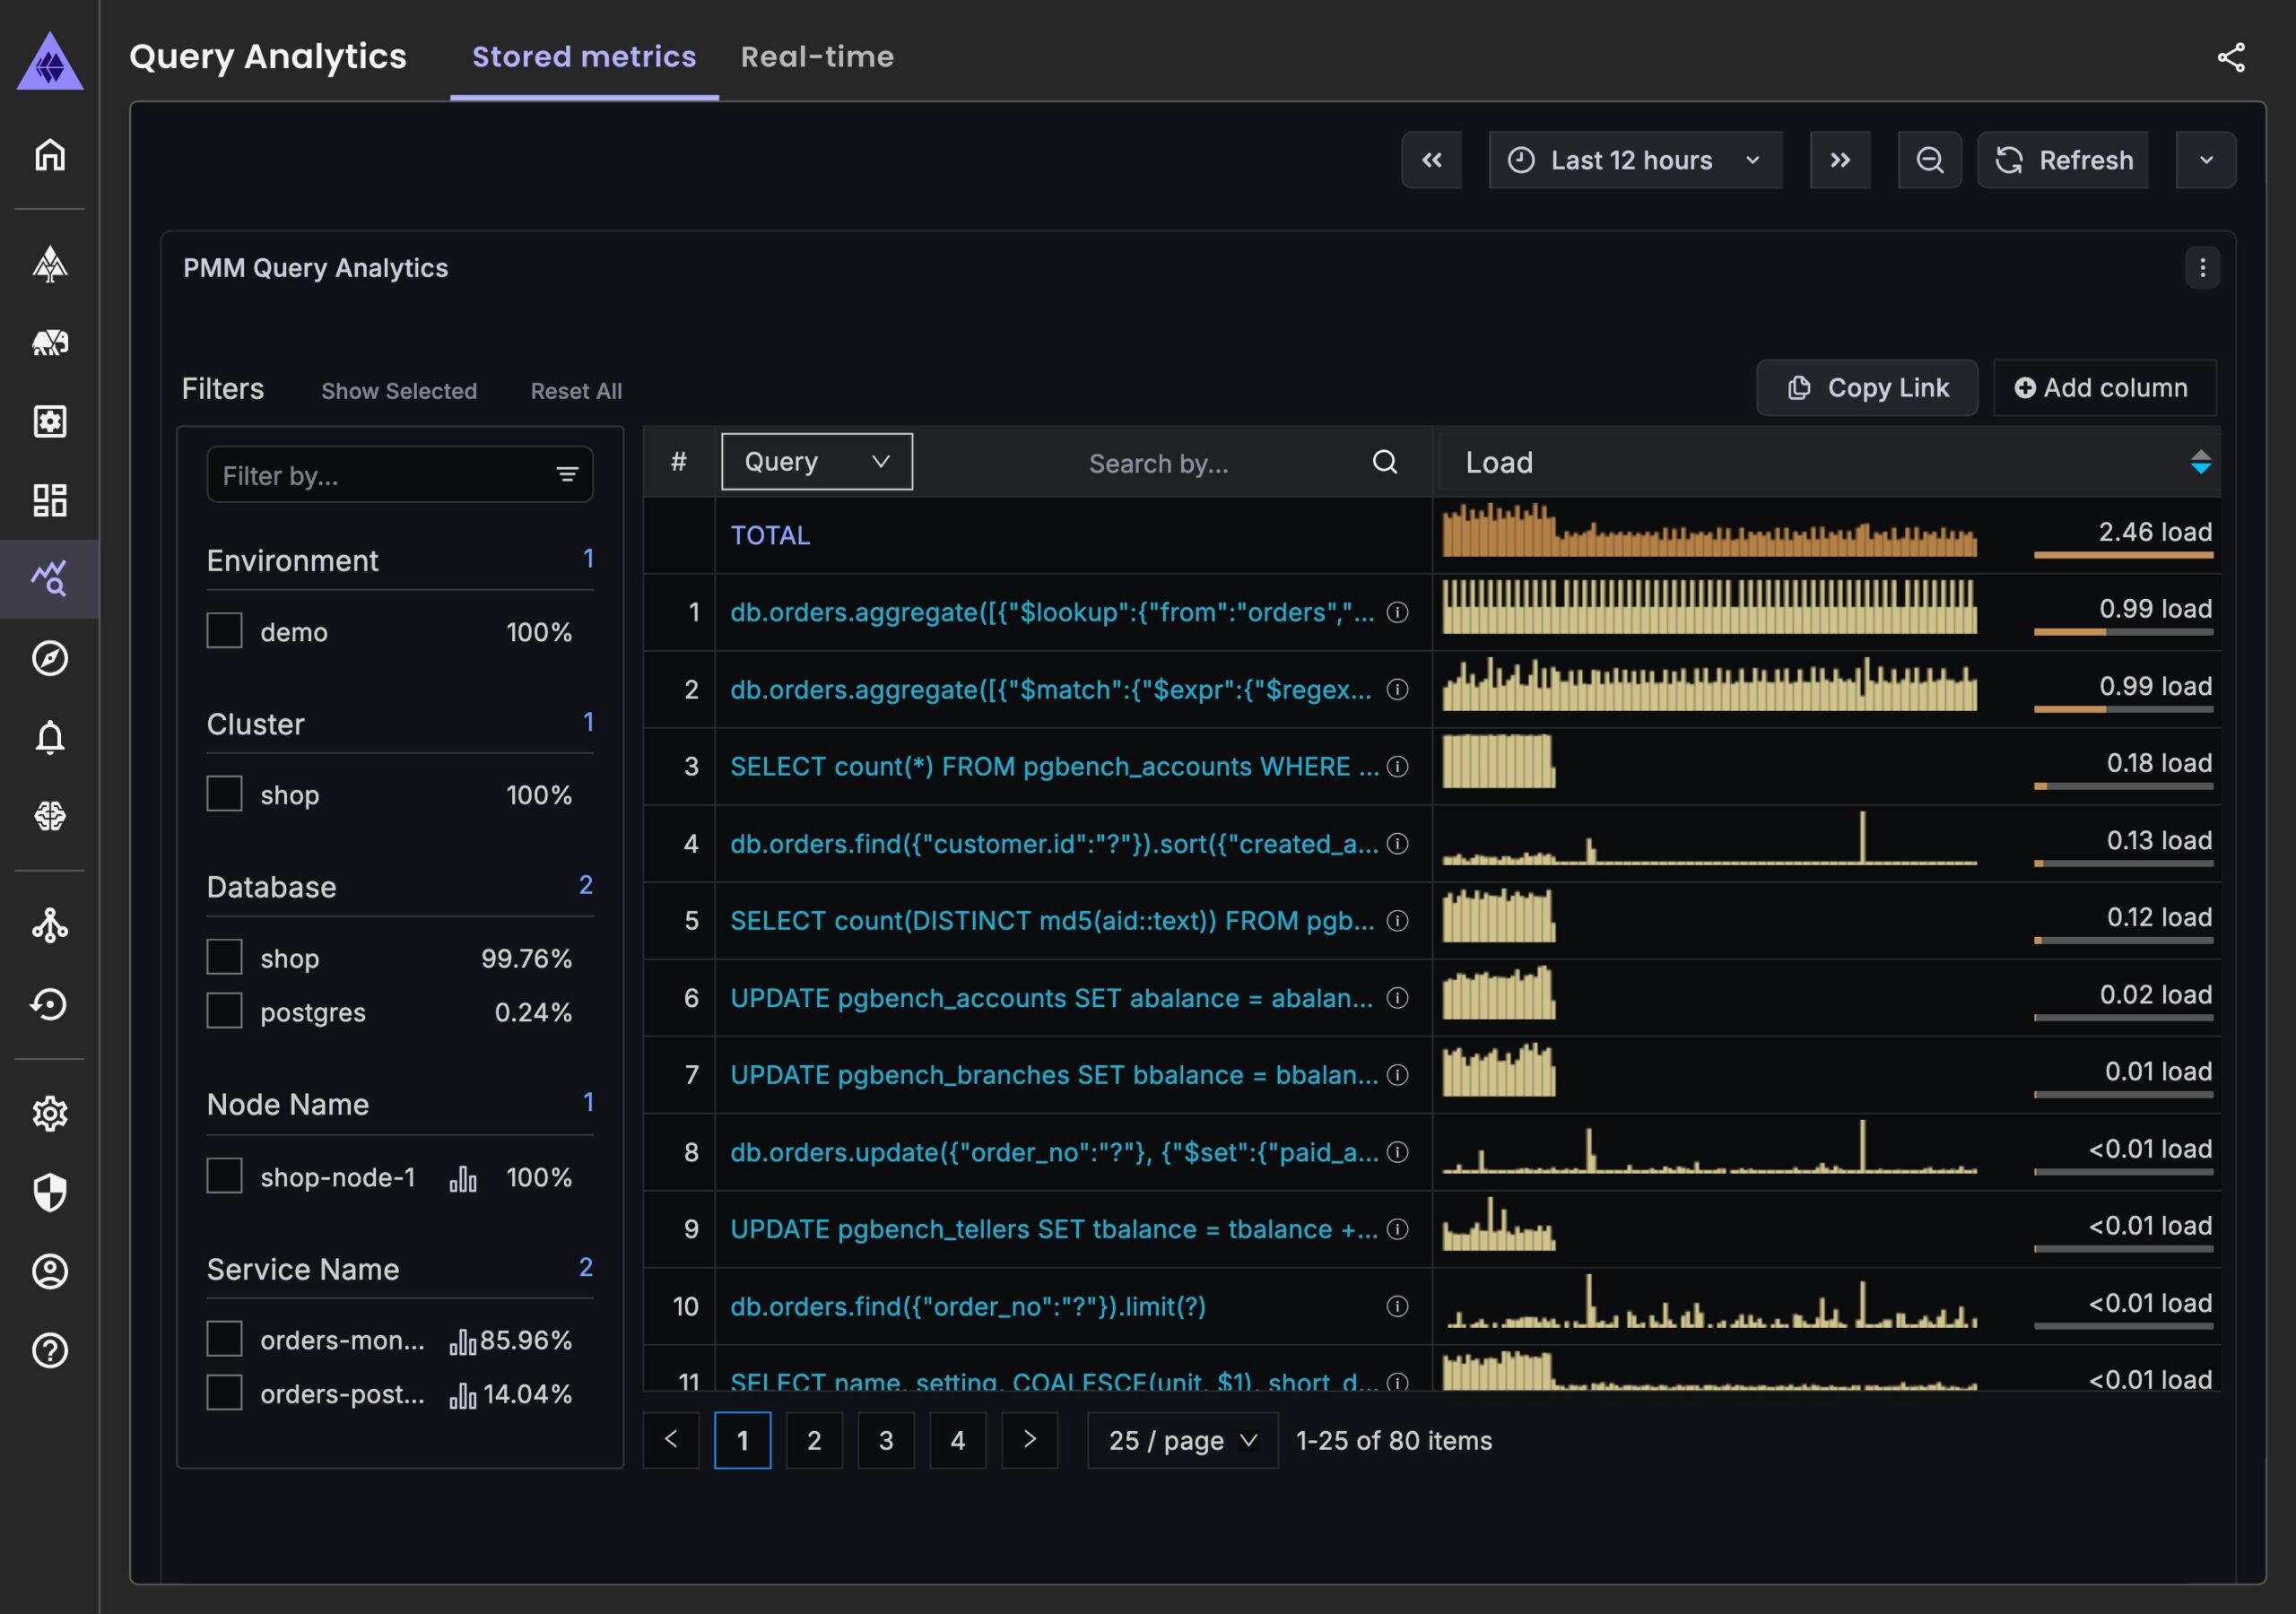 As we can see, two aggregations on the orders collection are on the top, basically each of them is keeping one core busy all the time. But are they running right now? For how long? Who is sending them? QAN can not tell, because it works with finished operations. MongoDB reports an operation to the diagnostic log or the profiler only when it completes, so an aggregation that has been running for two minutes and is still going is invisible there. So what can you do? Usually you open mongosh, run db.currentOp(), and scroll through a huge JSON document. Then you run it again, and again, to see if the operation is still there. I did this many times and I never really enjoyed it. (If you do, I will not judge you. 🙂 ) PMM has a better answer for this now: Real-Time Query Analytics, or RTA.
RTA shows every MongoDB operation that is running right now, refreshed every two seconds (which is configurable), and it forgets them when they are gone, but then you can find them in Query Analytics. It arrived in PMM 3.7.0 and for now it works with MongoDB only. MySQL and PostgreSQL support is planned. But how does it work? There is a new agent inside pmm-agent called rta-mongodb-agent. Every two seconds it runs the $currentOp aggregation on the admin database. The results go to PMM Server and they live in memory only. Nothing is written to ClickHouse, and an old snapshot is dropped after 30 seconds. So RTA does not replace QAN, it is the other half of it:
| Query Analytics (QAN) | Real-Time Analytics (RTA) | |
|---|---|---|
| What it shows | Finished queries, grouped by fingerprint | Operations running now, one row each |
| Data source on MongoDB | Profiler or slow query log | $currentOp, every 2 seconds |
| Storage | ClickHouse, with retention | Memory only |
| Answers | “What was slow last night?” | “What is slow right now?” |
The good news: there is nothing to install. If PMM already monitors your MongoDB, RTA uses the same connection details and credentials as the MongoDB exporter. You need:
Then:
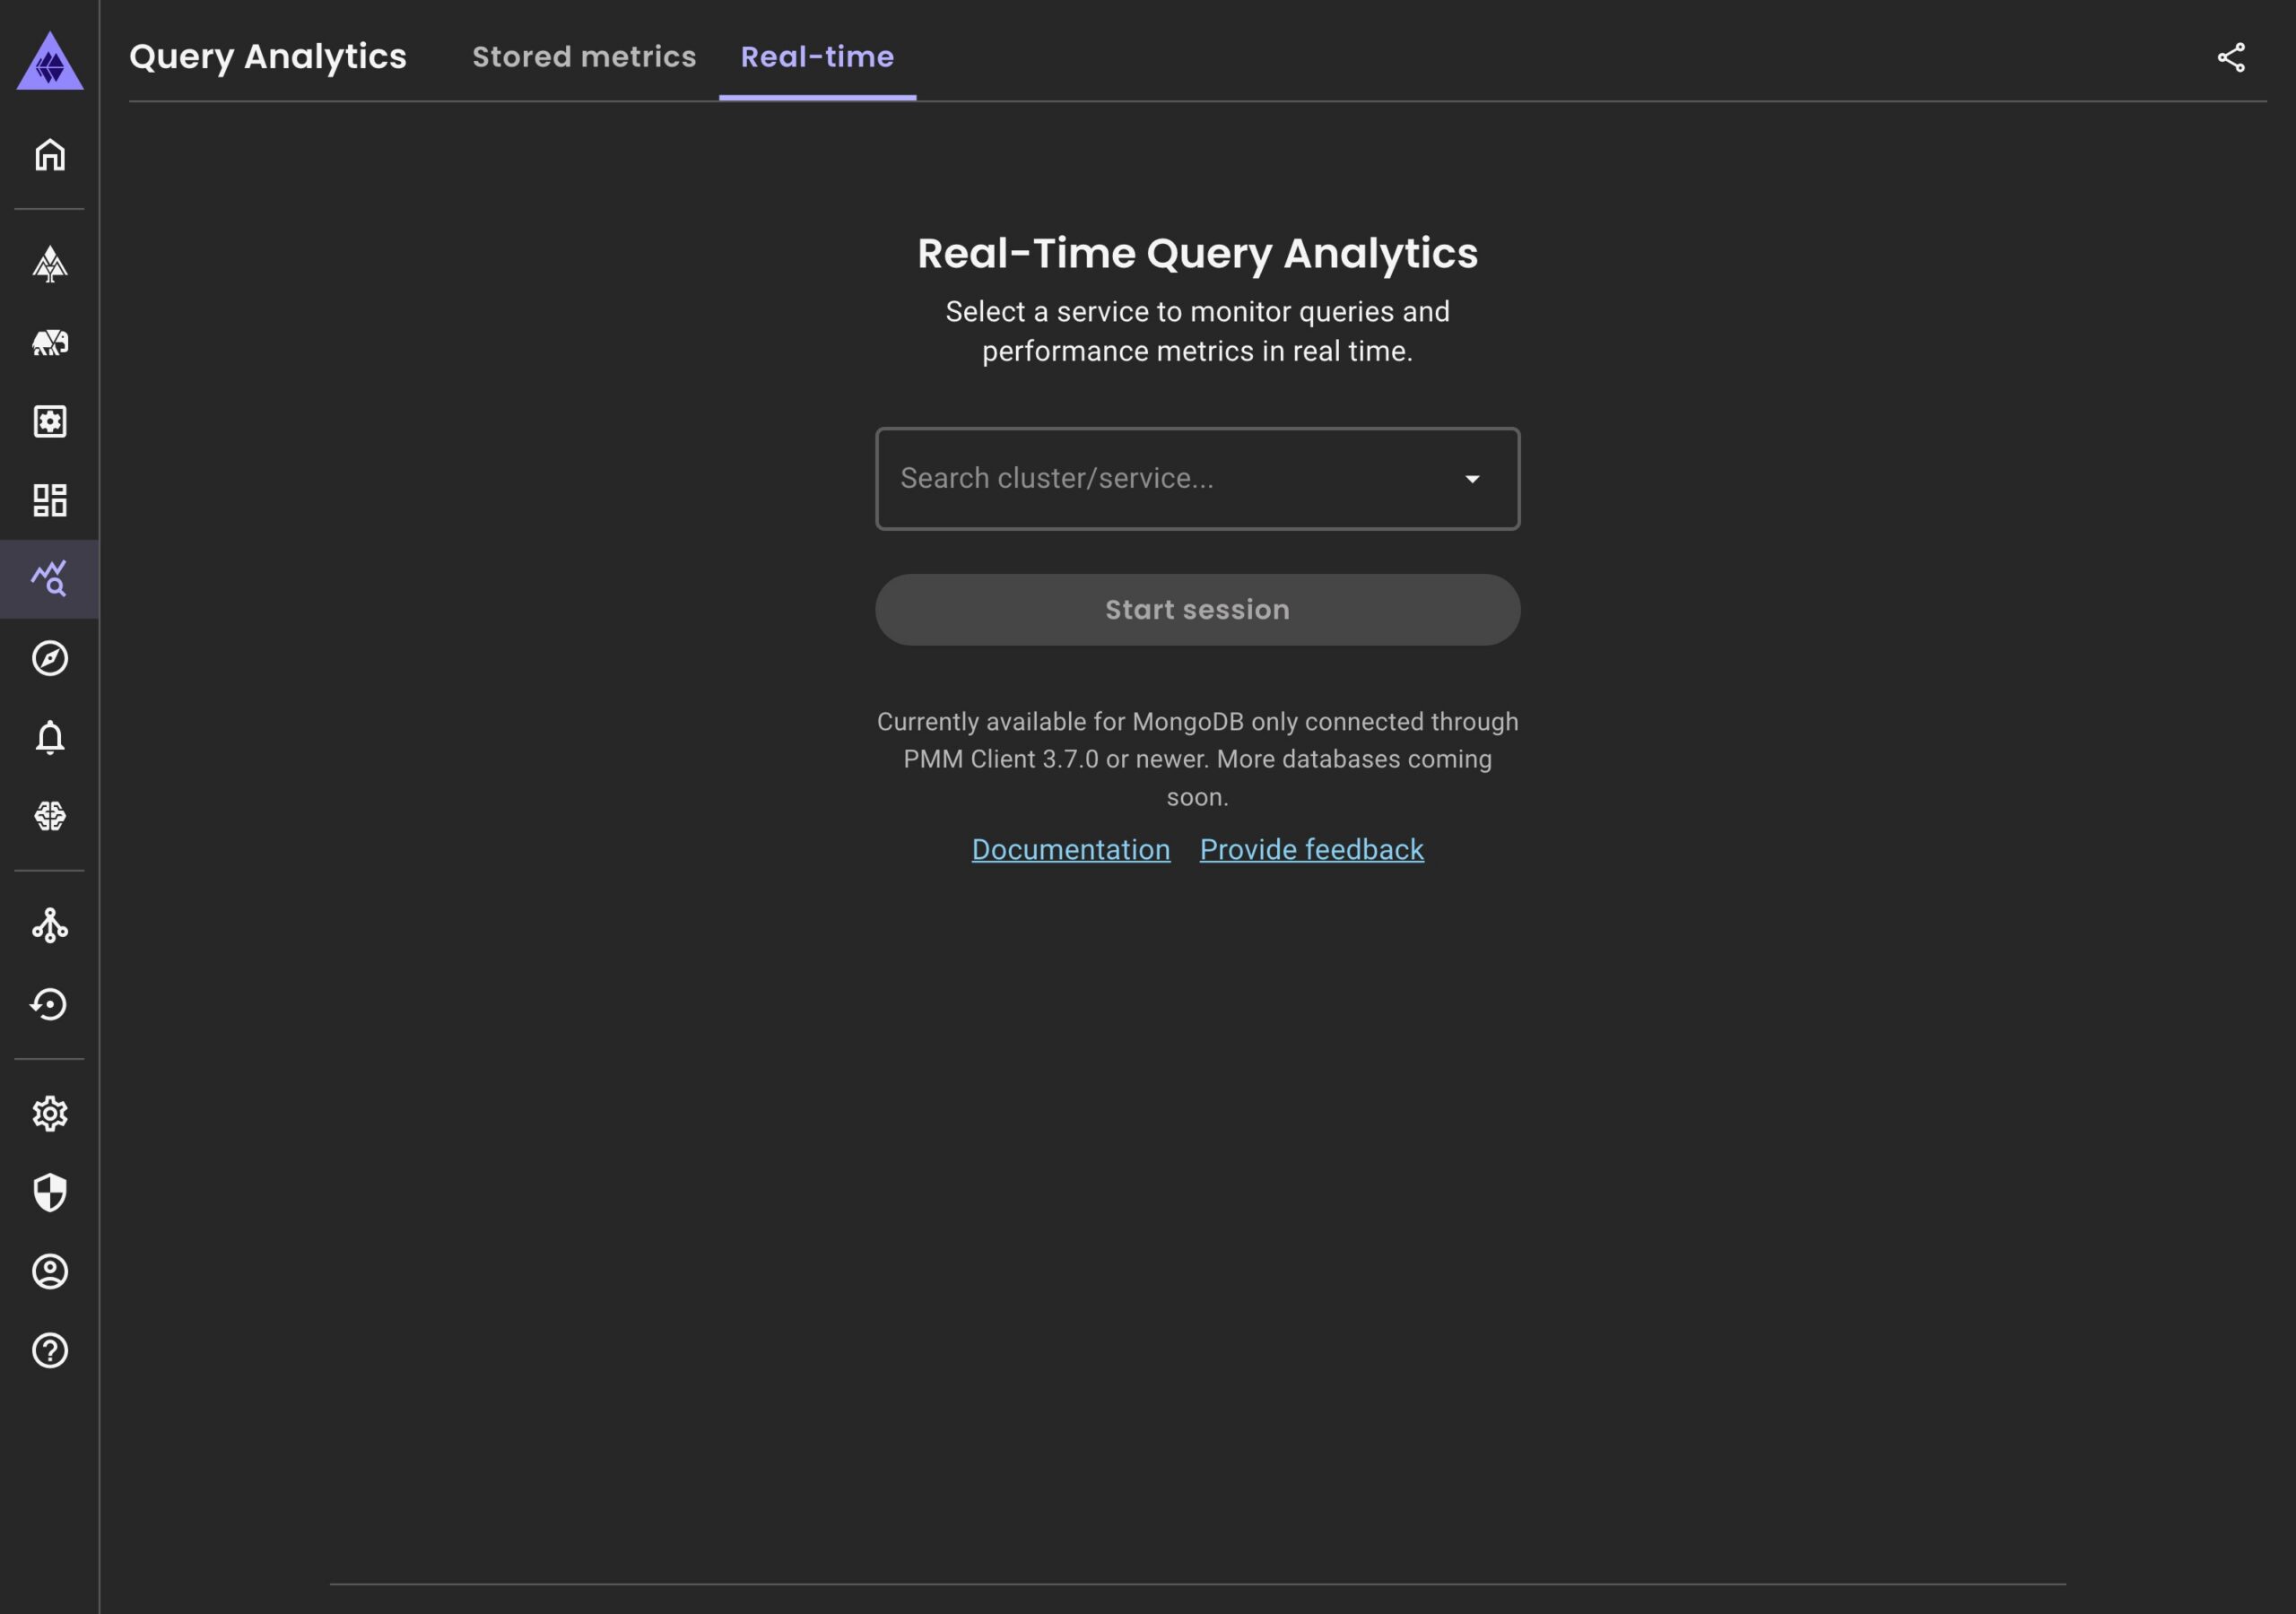 That’s it. In the background PMM creates an rta-mongodb-agent for the service, so you will see it in pmm-admin list as well. Each session connects directly to one MongoDB node. On a replica set, start a session for every member you want to watch; picking the cluster does exactly this. One important thing: a session does not stop by itself. It runs until somebody stops it on the All sessions page, and then it stops for all users. While it runs, the agent queries MongoDB every two seconds, so please stop the sessions you do not need. If two seconds is too often for you (or not often enough), you can change the collect interval with pmm-admin. The minimum is one second:
pmm-admin inventory change agent rta-mongodb-agent <agent-id> --collect-interval=5s
For this post (and for the video below) I built a small lab: Percona Server for MongoDB 8.0 with a shop.orders collection of 4 million documents, and three applications: orders-api, checkout-service and reporting-job. The reporting job runs a “duplicate customer check”. I think you can already guess which one is the problem. If you prefer watching, here is the whole flow in 51 seconds:
After Start session, the table shows every operation in flight. By default it refreshes every two seconds; the Auto-refresh menu goes from 1 to 5 seconds. I clicked the Elapsed time header to put the longest operations on top, but you can also filter queries or hosts using the free-form text field: 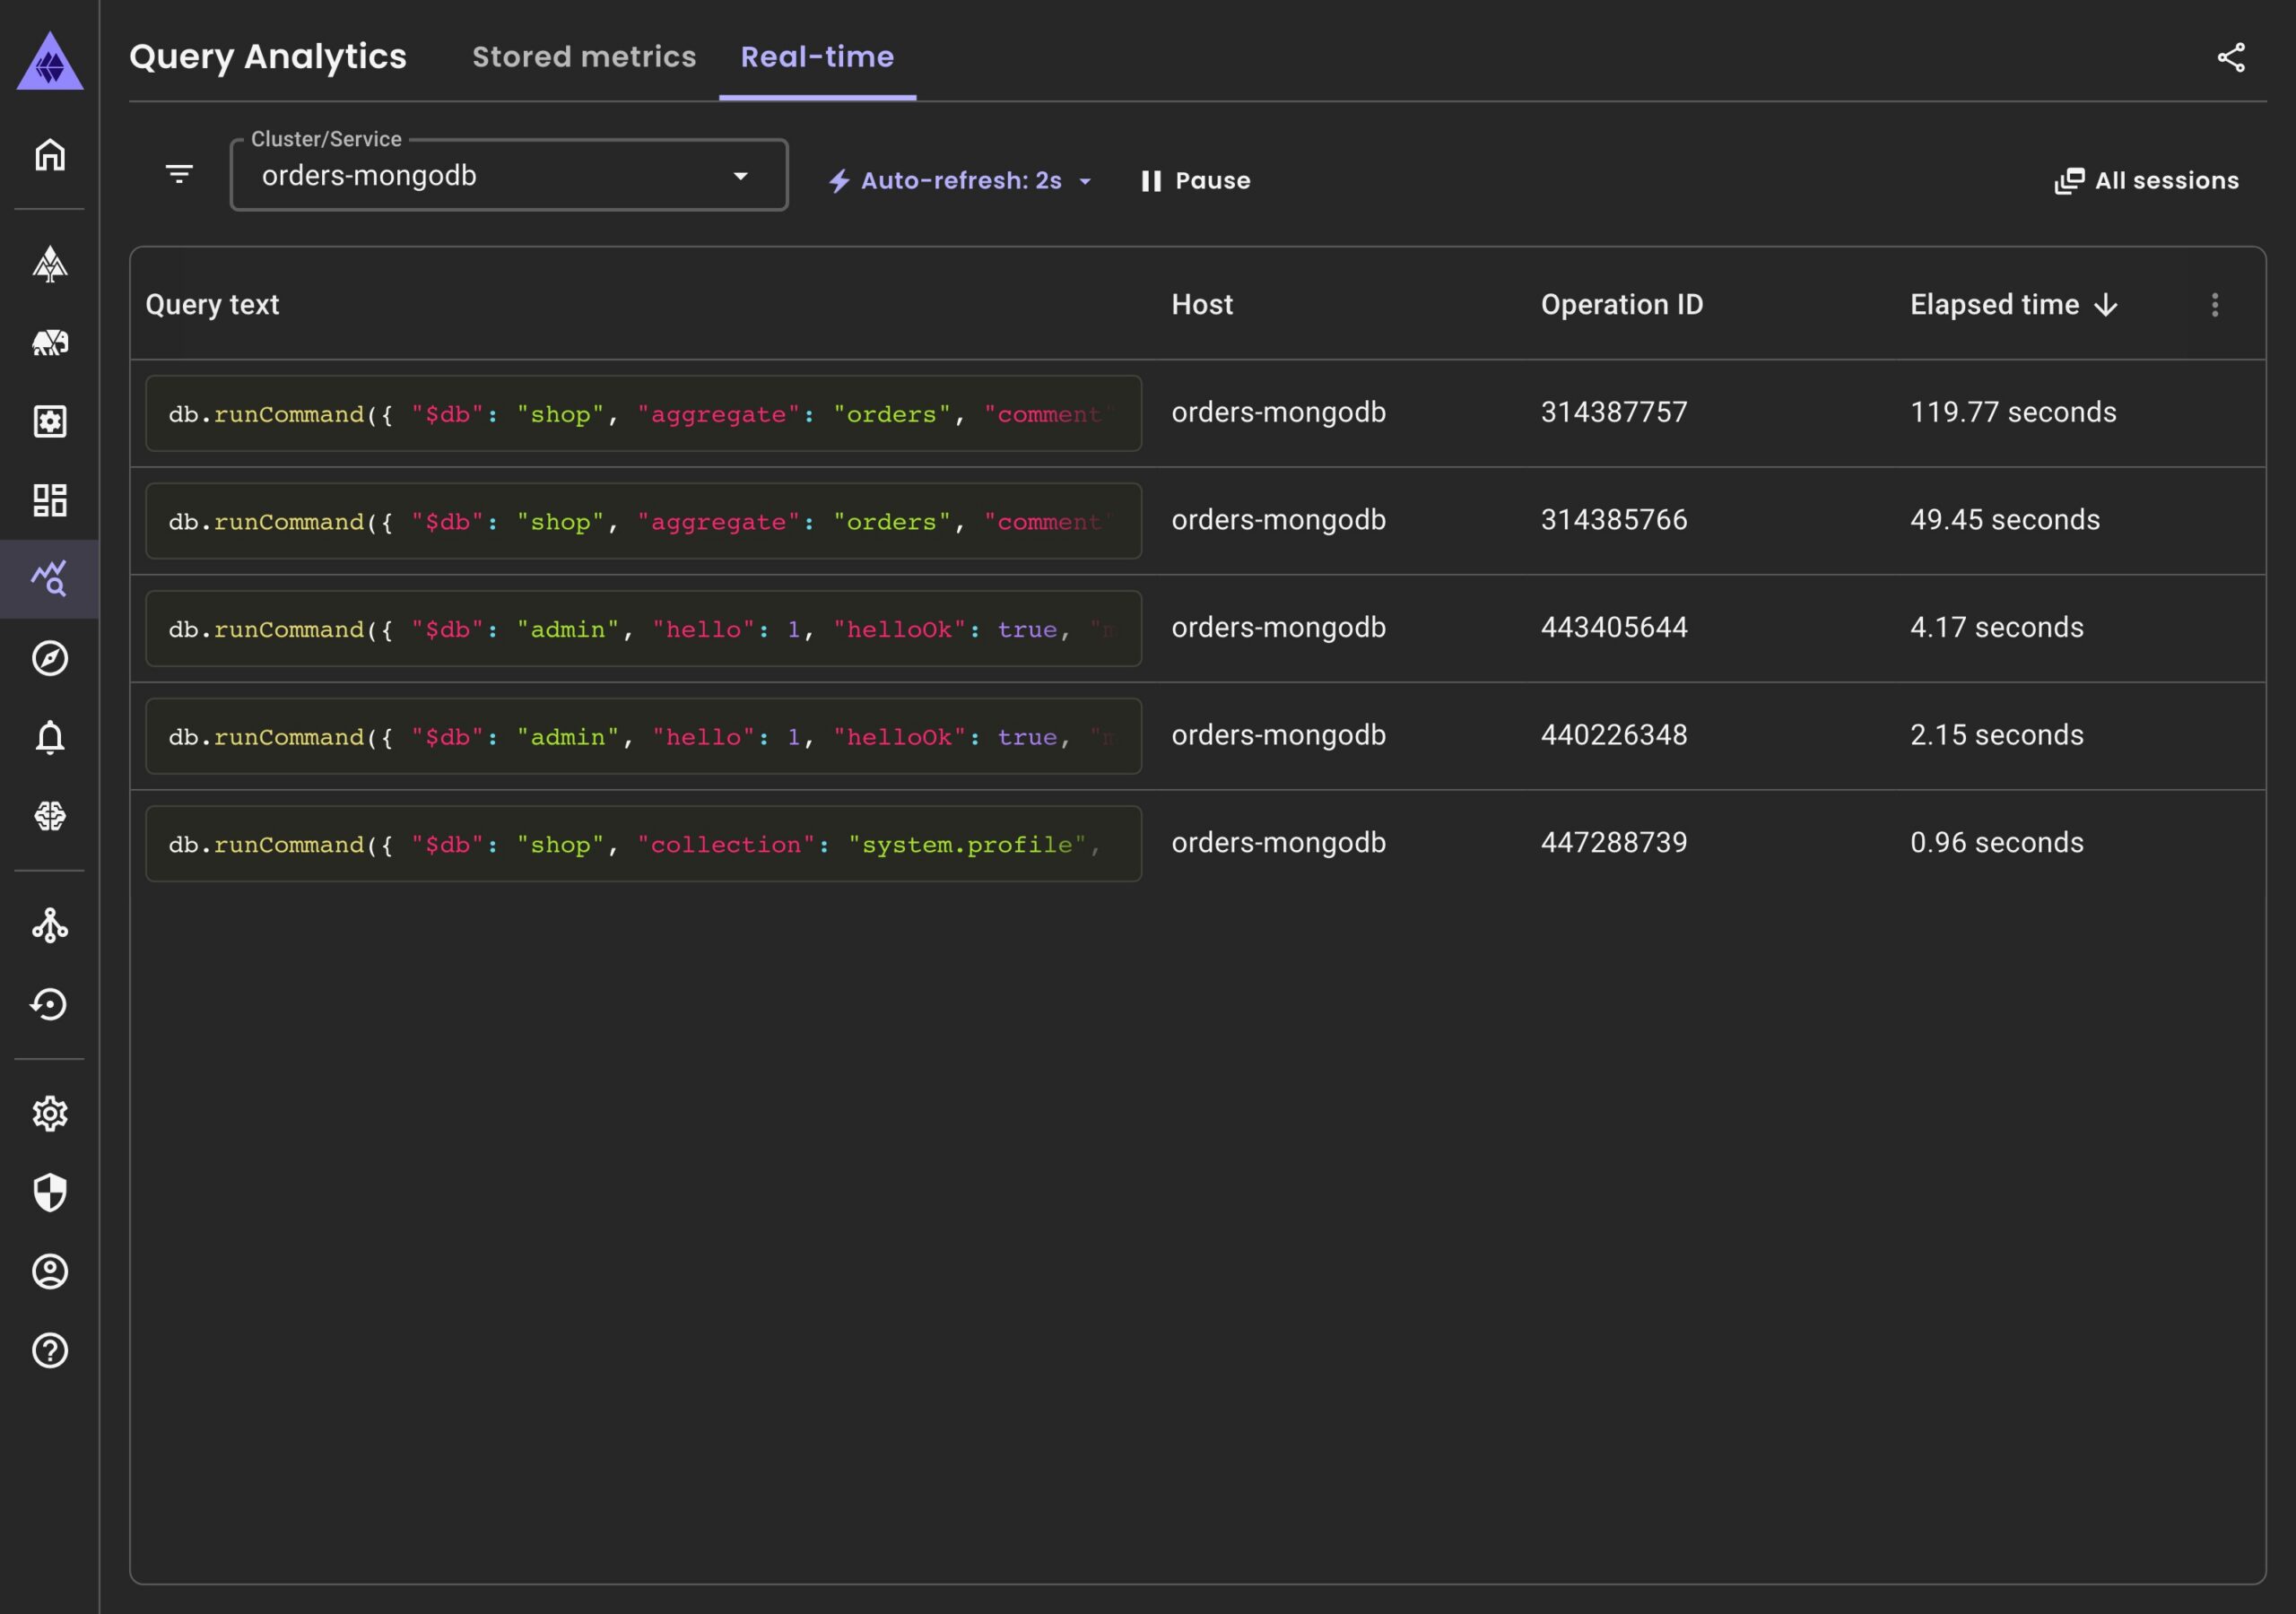 Two aggregations on orders, one running for almost two minutes and one for 49 seconds. We can also see some hello commands and a system.profile read. The hello ones are drivers waiting for topology changes, and the system.profile one is PMM’s QAN agent reading the profiler. So yes, PMM is monitoring itself a little bit. You can ignore these.
Click the top row, and the details open. The stream pauses while the panel is open, so the row does not jump away while you read it: And here is everything we need: 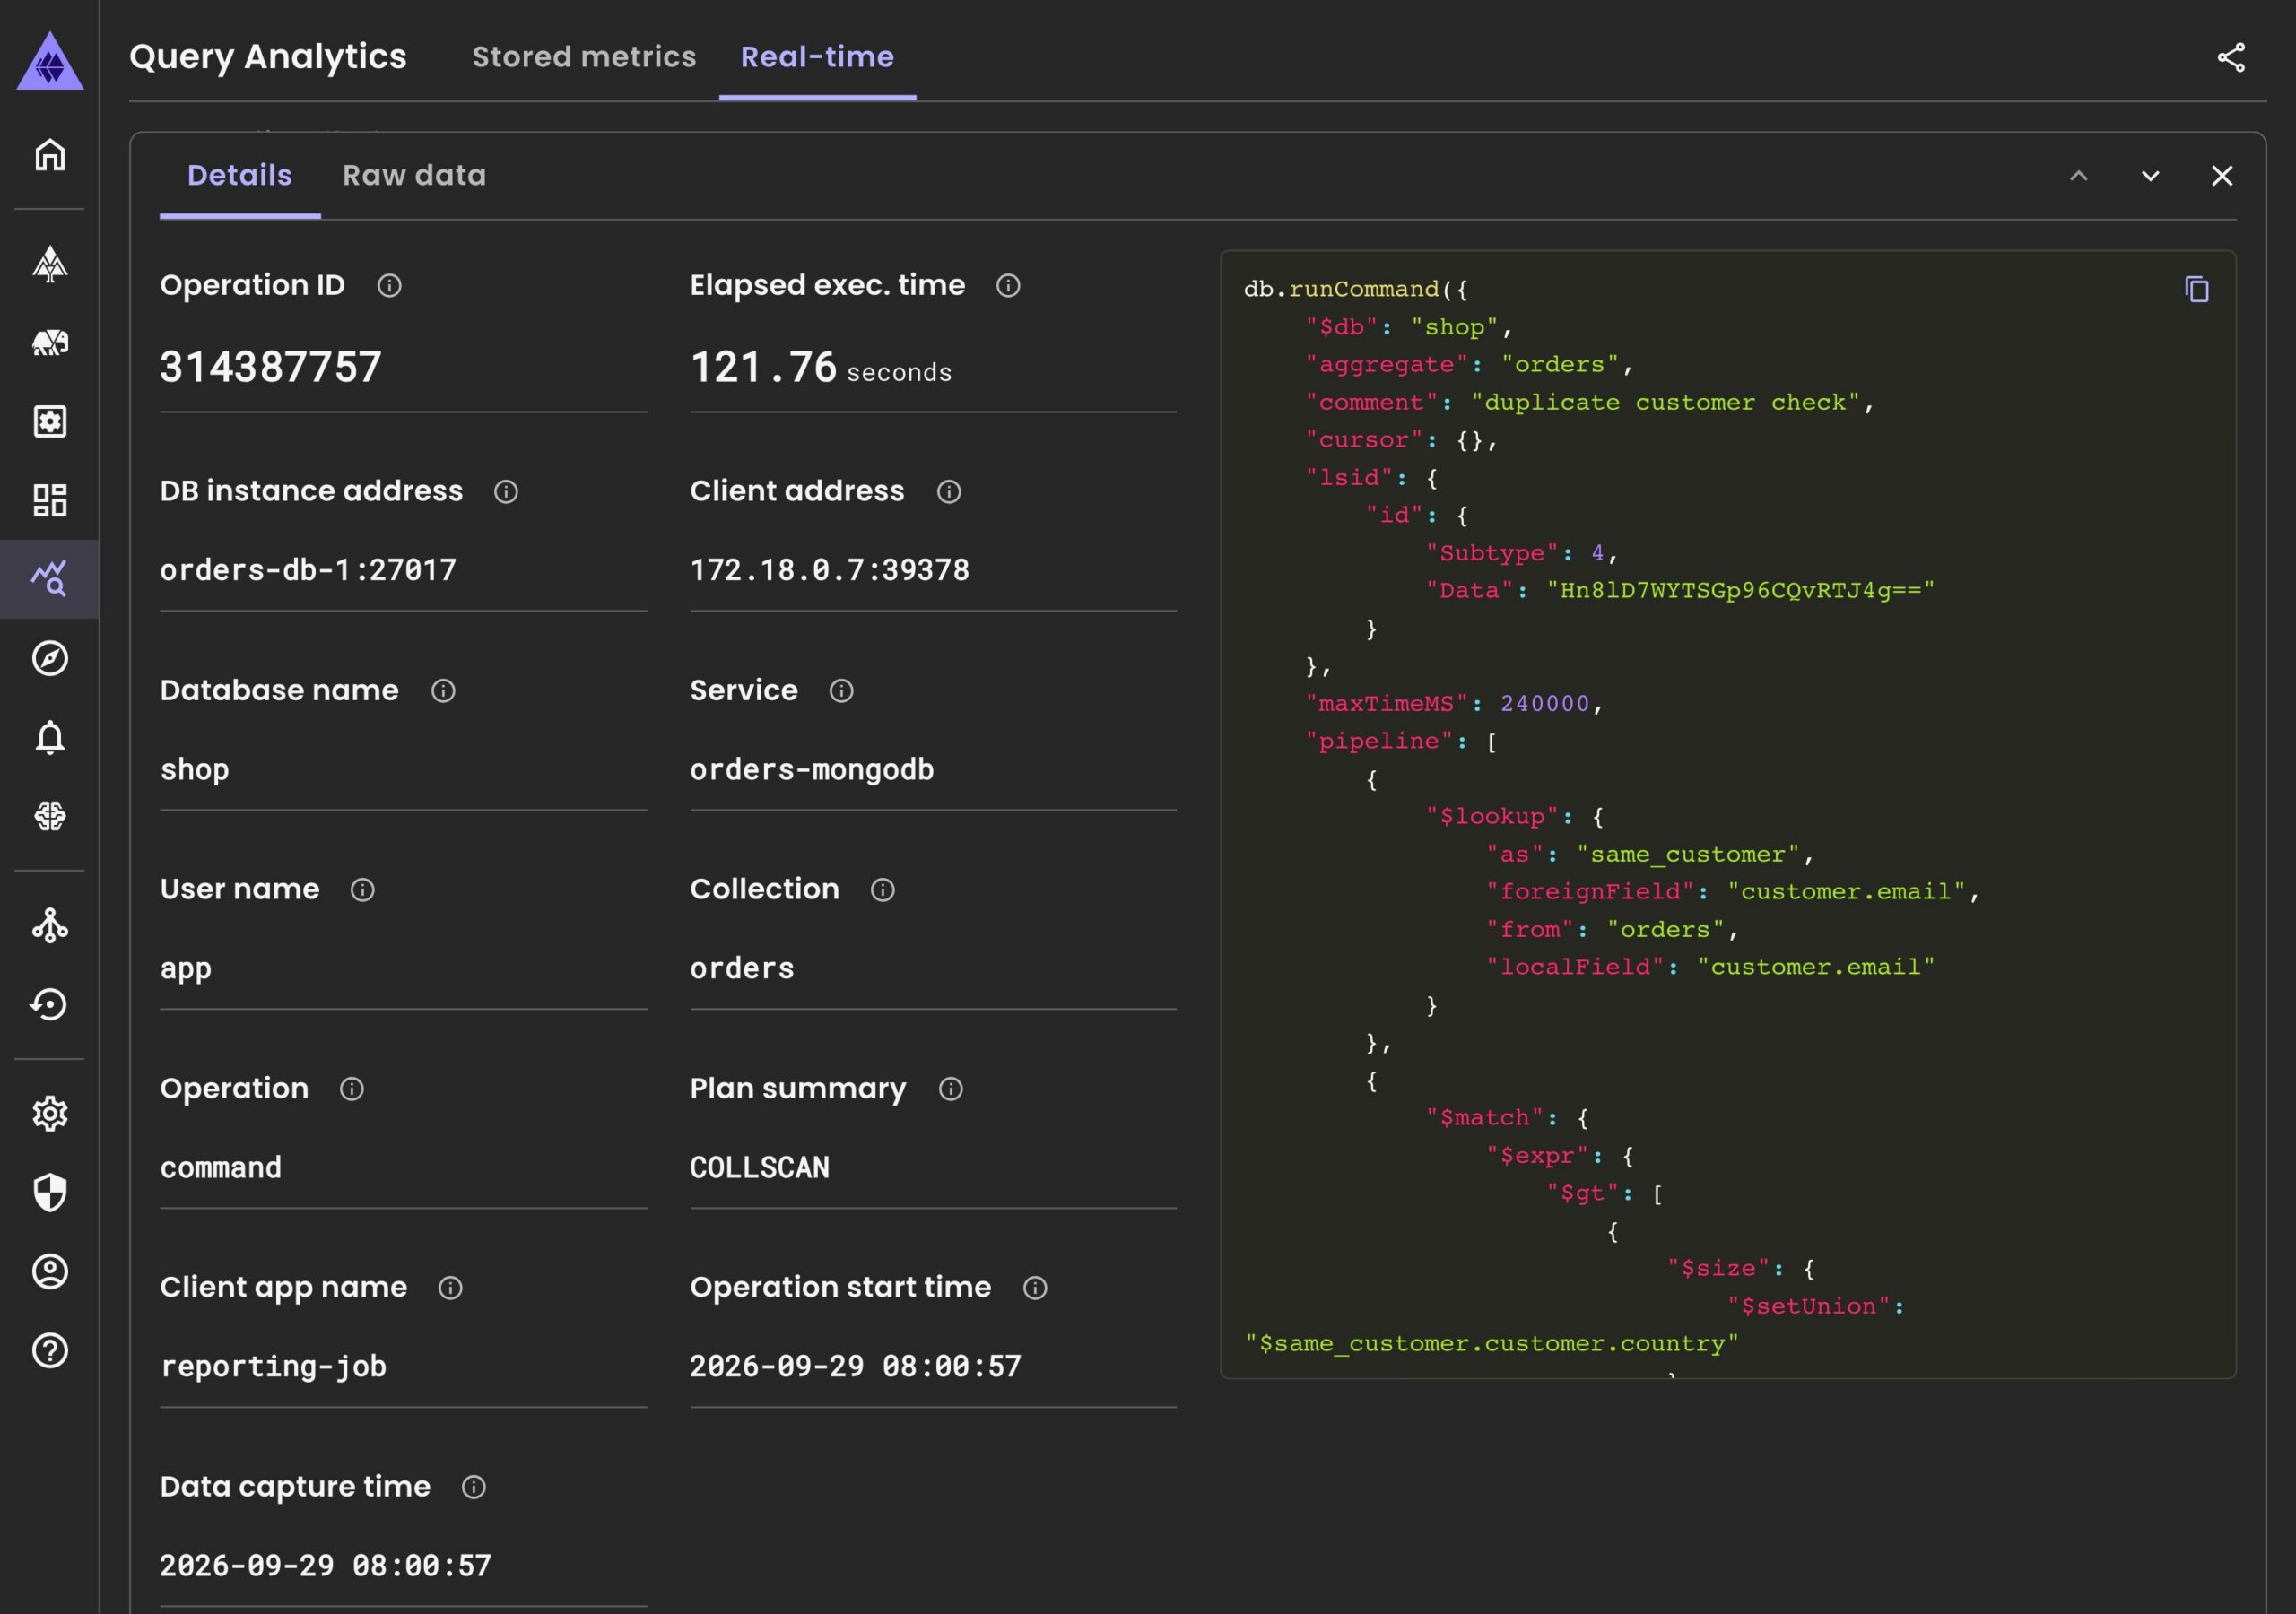
QAN will show this aggregation too, but only after it ends. RTA shows it while it is running, with the client, the plan and the full command. If you need more, the Raw data tab has the whole $currentOp document, locks included.
There is no kill button in RTA, and I think this is a good decision. If you really have to stop the operation, copy the Operation ID and run it yourself:
db.killOp(314387757)
Of course, please make sure you know what you are killing, especially if it is a write. And killing it only buys you time, because the job will start it again. The real fix here is an index on the join field:
db.orders.createIndex({ "customer.email": 1 })
RTA keeps nothing, so if you want to show this to somebody tomorrow, click Pause and then Export: 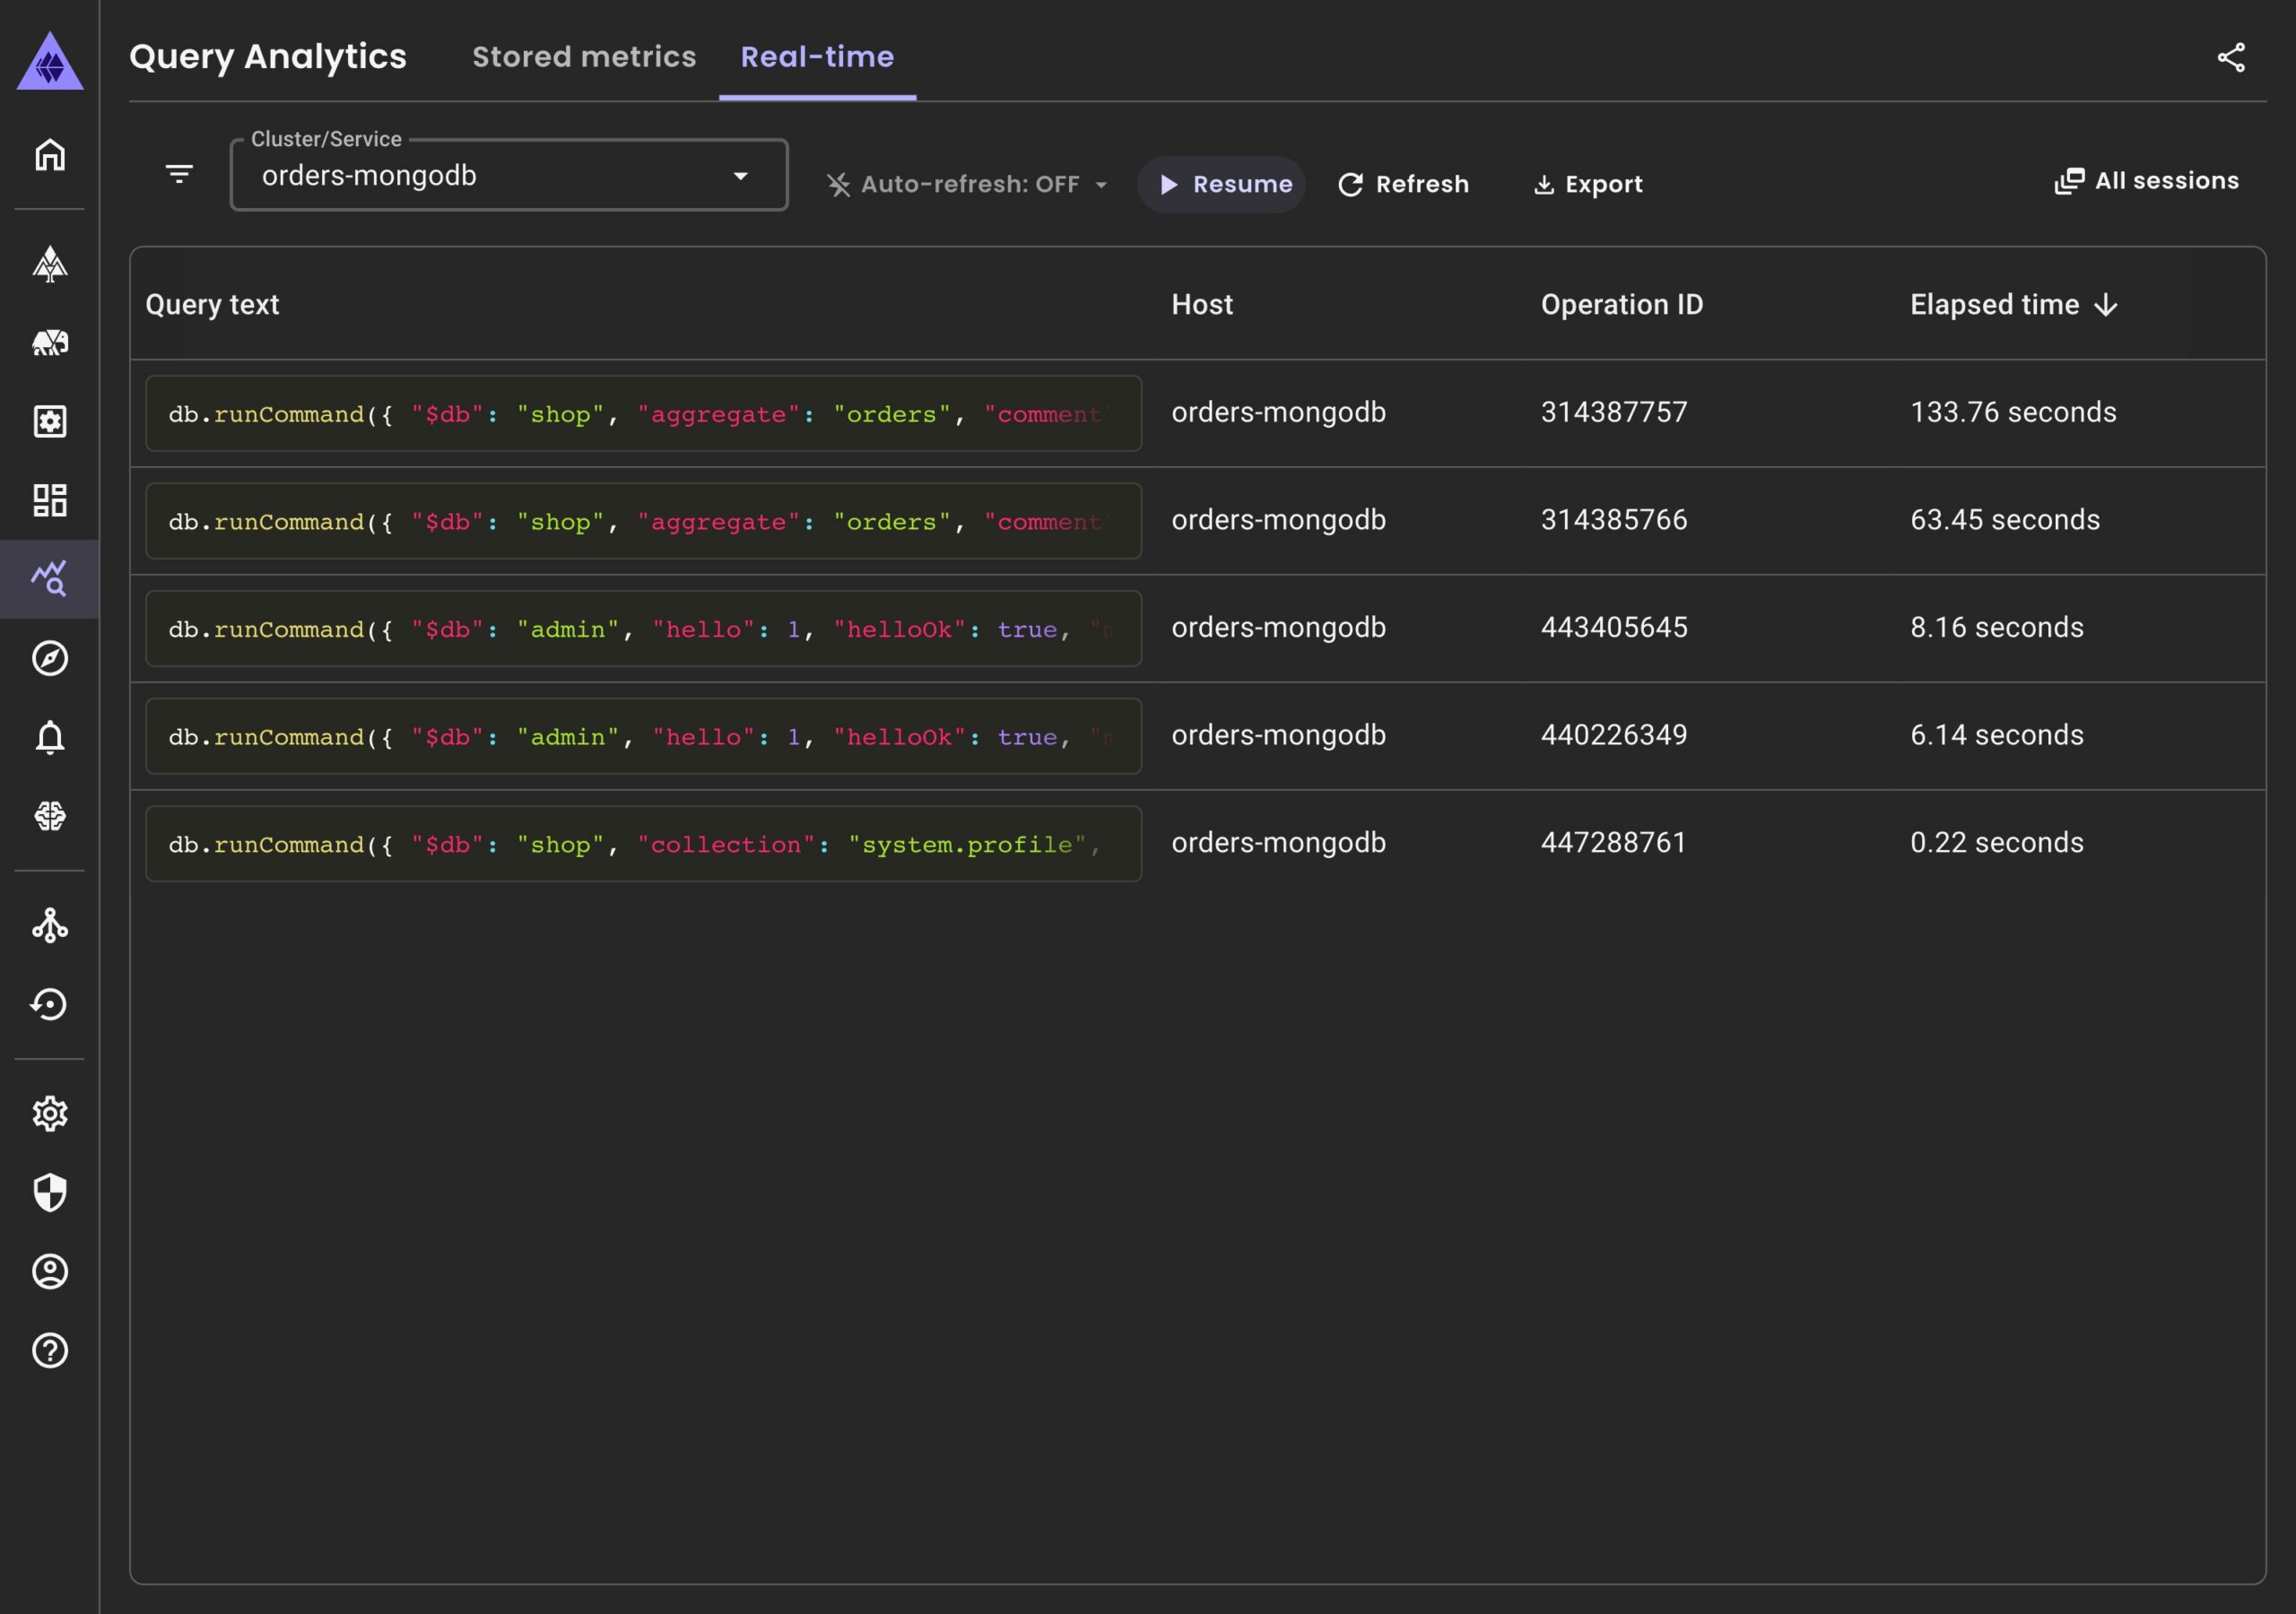 The CSV has every row that passes your current filters, across all pages, including the raw query. This is very useful for the incident report, or when you want to send it to a colleague (or to Percona Support). Even a query that never finishes leaves evidence this way.
Yes, a few, and it is good to know them before you rely on RTA during an incident:
RTA answers the question QAN never could: what is running right now? There is nothing to install, it uses the MongoDB connection PMM already has, and in the video it takes less than a minute to go from “MongoDB is slow” to “the reporting job does a COLLSCAN because customer.email has no index”. No more db.currentOp() in a loop during an incident. I think this is a great addition to QAN, and I am waiting for the MySQL and PostgreSQL versions as well. The full documentation is here. If you already use RTA in production, I would like to hear your real-life experiences in the comments or on the PMM forum.
Resources
RELATED POSTS