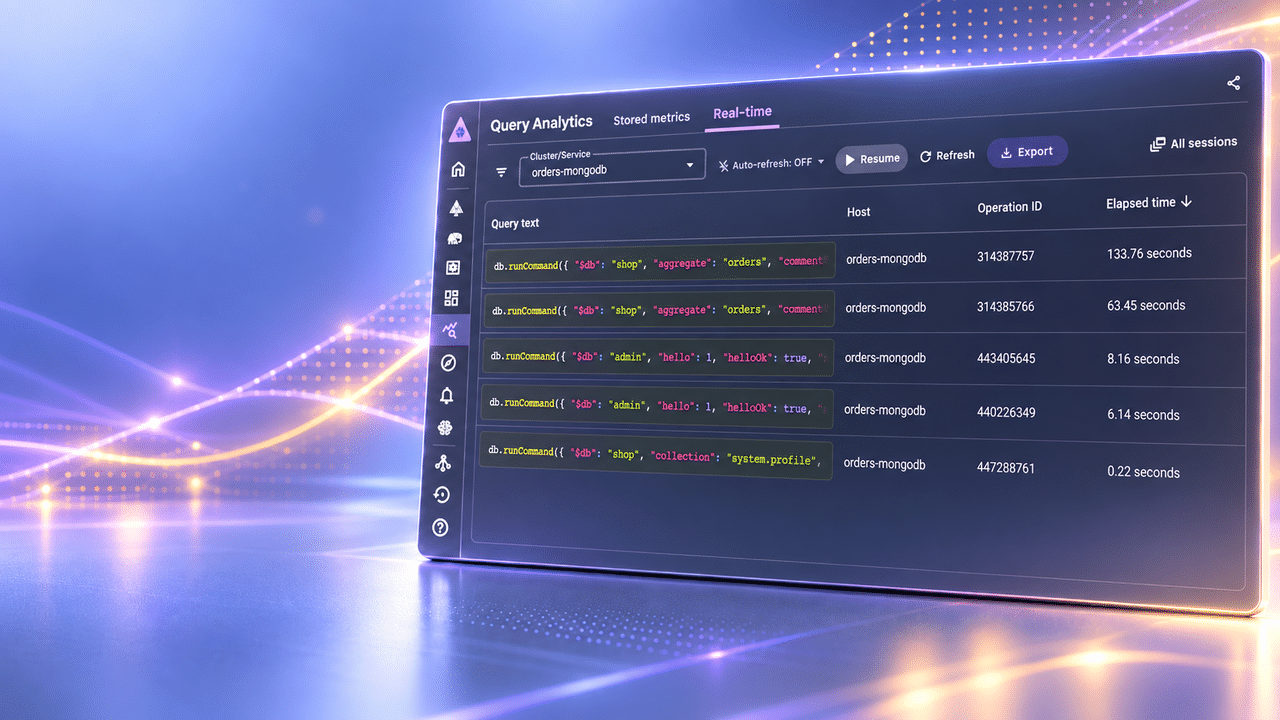

Every MongoDB server keeps a flight recorder. It’s called FTDC, Full Time Diagnostic Data Capture, and it writes about 5,700 metrics every second into a folder called diagnostic.data, right next to your log. It’s delta-encoded and compressed so aggressively that days of history fit in a few hundred megabytes.
You’ve probably never looked at it. But if you’ve ever opened a performance ticket with MongoDB, it’s the first thing they asked you for, and there’s a good reason: when your cluster goes strange for twenty minutes on a Tuesday, this is usually the only artifact that can tell you what actually happened. Not a five-minute average. The WiredTiger ticket pool, second by second.
If you run your own servers, Percona Server for MongoDB, community MongoDB, whatever you manage yourself, that file is just sitting on disk. You copy it and you look at it.
On Atlas, the same file is written by the same code on a machine you’re paying for, and you can’t get to it. It isn’t in the UI. The log download gives you mongodb.gz and your audit logs and nothing else. Somebody asked how to do this on GitHub back in February 2021 and nobody ever answered.
There is a way. It just isn’t where you’d look. Everything below I ran against an Atlas M10 on MongoDB 8.0.29.
There’s an endpoint that packages FTDC on demand. Three calls and you have it:
|
1 2 3 4 5 6 7 8 9 10 11 12 13 |
BASE="https://cloud.mongodb.com/api/atlas/v1.0/groups/$GROUP_ID" AUTH=(-u "$PUB:$PRIV" --digest -sS) # 1. create the job curl "${AUTH[@]}" -X POST "$BASE/logCollectionJobs" -H 'Content-Type: application/json' \ -d '{"resourceType":"REPLICASET","resourceName":"<rs-name>","redacted":true, "sizeRequestedPerFileBytes":100000000,"logTypes":["FTDC"]}' # 2. poll until it says SUCCESS curl "${AUTH[@]}" "$BASE/logCollectionJobs/<job_id>" # 3. download curl "${AUTH[@]}" "$BASE/logCollectionJobs/<job_id>/download" -o ftdc.tar.gz |
A few things that will trip you up. <rs-name> is the internal replica set name, not the display name you gave your cluster, run GET $BASE/processes and you’ll see it next to each host. You need a programmatic API key, not a database user. And if your organization requires an access list for API keys, add your IP first or the very first call comes back with ORG_REQUIRES_ACCESS_LIST.
What you get is the real thing: one diagnostic.data directory per replica set member, in exactly the layout every FTDC tool already understands.
Don’t ignore metrics.interim. That’s the chunk the server hasn’t flushed to a numbered file yet, and it holds your most recent samples. In my bundle the newest numbered file stopped at 22:33 while the interim carried data all the way to 22:38. If you’re chasing something that just happened, that’s the file you need.
Here’s the part that will hurt you if you don’t know it.
The bundle includes a metadata document with getCmdLineOpts in it, which tells you how Atlas starts mongod. There it is:
|
1 |
diagnosticDataCollectionDirectorySizeMB: 400 |
That’s twice the mongod default of 200 MB, and it’s a hard ceiling. When the directory fills up, the oldest file gets deleted. No warning, no archive.
How long 400 MB lasts depends entirely on how hard your cluster is working, because FTDC compresses by delta, a metric that sits still costs you almost nothing, a metric that moves every second costs real bytes. On an idle cluster I measured about 0.93 MB per 32 minutes per node, which works out to something close to ten days. On a busy production cluster, expect two to five.
So picture the usual sequence. Something goes wrong on a Thursday night. Nobody’s sure how bad it was. The postmortem gets scheduled for the following week, somebody finally asks what the cluster was actually doing at 3 AM, and the answer is gone. Not archived somewhere. Gone.
Collect during the incident, not during the retrospective. On your own servers this is a setting you control: raise diagnosticDataCollectionDirectorySizeMB, or copy the directory somewhere durable on a cron. On Atlas it’s a ceiling somebody else picked for you, and the only way around it is to pull the data yourself before it rolls off.
None of what I just showed you is documented anywhere.
Think about what FTDC actually is. It’s the first artifact MongoDB support asks for on a performance ticket. It contains no user data, it’s counters, and you can verify that yourself: I looked at 228 KB of diagnostic document and found 38 distinct strings, not one of them the name of a database or collection on the cluster. It’s the single most useful thing you can hand to somebody debugging your server, and it’s safe to share.
And on MongoDB’s own managed platform, the only way to get it is an endpoint that appears nowhere in the log download UI, isn’t mentioned in the Atlas docs, and sits on an API version that never made it to v2.
What you end up with is a two-tier arrangement. The engineers supporting your cluster work from the full second-by-second record. You work from a metrics page with a few dozen series and seven days of retention.
I don’t think anyone decided this. It reads like a capability nobody owned the job of surfacing, the endpoint exists and it works, after all. But intent doesn’t change what it costs you, and right now the gap is being filled by community projects with single-digit star counts. A “Download diagnostic data” button next to “Download logs” would close it in an afternoon.
This is the kind of thing that gets abstracted away when your database becomes somebody else’s service, and it’s almost never what anyone evaluates up front. You compare features and uptime. You don’t think to ask whether you’ll still be able to see what your own server was doing.
Once you have the folder, you need something to open it with, and the tooling here is thinner than the data deserves.
keyhole (https://github.com/simagix/keyhole) has been the reference for years and renders FTDC through Grafana. If you want dashboards and don’t mind standing up the stack, start there.
I built Big Hole (https://github.com/zelmario/Big-hole) for the other case, opening a capture the way you open a log file. It runs entirely in your browser: no backend, no container, nothing uploaded. You drop the folder in and it decodes on your machine. That turns out to matter a lot with this particular file, because the captures worth analysing usually belong to somebody else’s production cluster, and “nothing leaves your machine” is often the difference between being allowed to look at it and not. It opens the Atlas tarball as-is, puts every replica set member on one time axis, shows you who was primary when, overlays your mongod.log on the same timeline, and runs automated checks for the usual suspects, ticket pool exhaustion, cache pressure, flow control. MIT licensed, tested against MongoDB 4.4 through 8.0. You can see a live demo here: https://zelmario.github.io/Big-hole/
Pick whichever you like. Just don’t wait until you need it, by then the data you wanted is already gone.
Resources
RELATED POSTS