
 Autumn brought new cool features and improvements to Percona Monitoring and Management (PMM) in V2.31. Enhanced user experience with the updated main menu, Alerting, and better PostgreSQL autovacuum observability with the new Vacuum dashboard are the major themes that we focused on in this release. Check out our Release Note of 2.31 for the full list of new features, enhancements, and bug fixes.
You can get started with PMM in minutes with the PMM Demo to check out the latest version of PMM V2.31.
Some of the highlights in PMM V2.31 include:
We are excited to introduce a streamlined alert setup process in PMM with an overhauled, unified alerting system based on Grafana.
All Alerting functionality is now consolidated in a single pane of glass on the Alerting page. From here, you can configure, create and monitor alerts based on Percona or Grafana templates.
The Alert Rules tab has also evolved into a more intuitive interface with an added layer for simplifying complex Grafana rules. You’ll find that the new Percona templated alert option here offers the same functionality available in the Tech Preview of Integrated Alerting but uses a friendlier interface with very advanced alerting capabilities.
As an important and generally useful feature, this new Alerting feature is now enabled by default and ready to use in production!
For more information about Percona Alerting, check out Alerting doc.
The new Percona Alerting feature fully replaces the old Integrated Alerting Tech Preview available in previous PMM versions. The new alerting brings full feature parity with Integrated Alerting, along with additional benefits like Grafana-based alert rules and a unified alerting command center.
However, alert rules created with Integrated Alerting are not automatically migrated to Percona Alerting. After upgrading, make sure to manually migrate any custom alert rules that you want to transfer to PMM 2.31 using the script
We have powered-up PMM with Grafana 9.1 by drawing on its latest features and improvements. Here is the list of features and enhancements that have been shipped in this release:
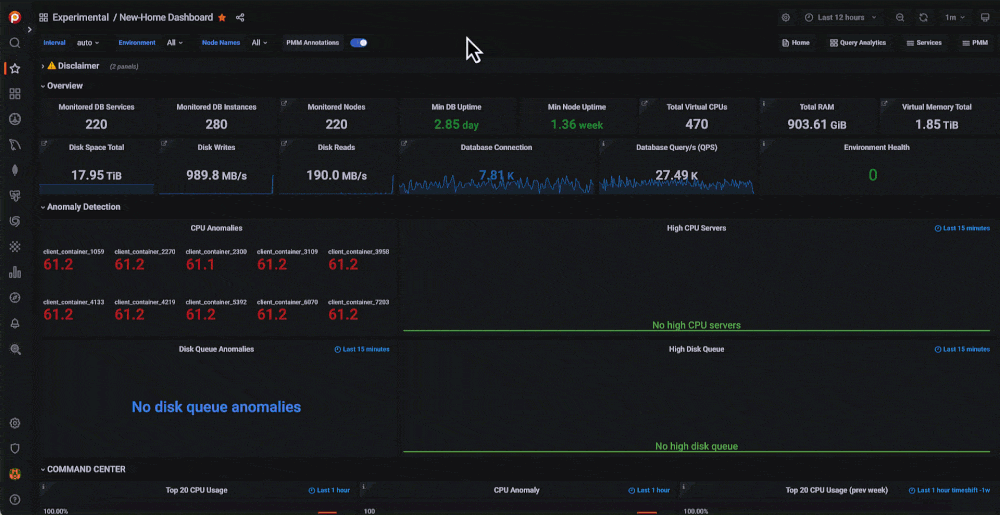
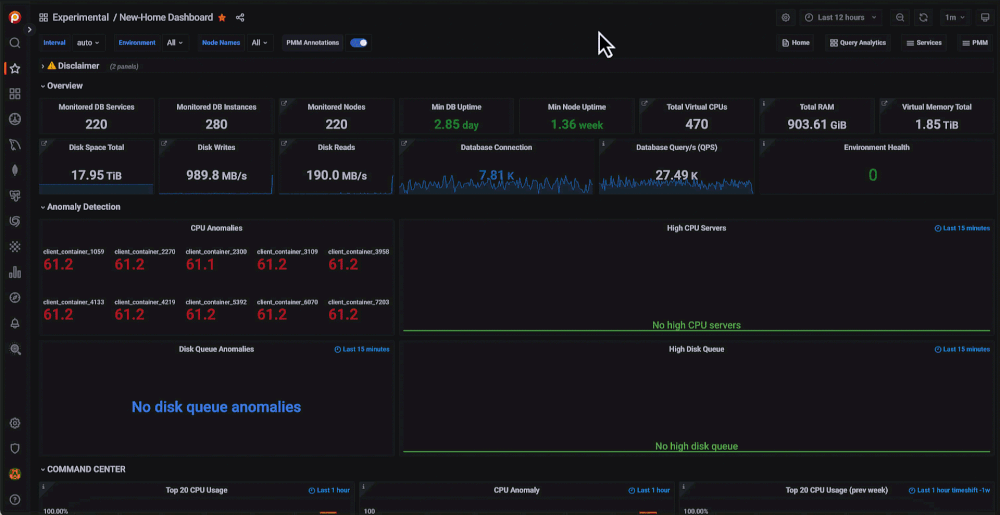
With the 2.31 release, we introduce a more user-friendly and accessible main menu inspired by Grafana’s expandable side menu. PMM dashboards are the heart of the monitoring, and we aimed to provide quick and easy access to the frequently used dashboard from the main menu. On this menu, you’ll be able to browse dashboards with one click, like Operating System, MySQL, MongoDB, PostgreSQL, etc.
PMM provides many custom dashboards with dozens of metrics to monitor your databases. Most users in an organization use just a handful of dashboards regularly; now, it is much easier to access them by saving the most frequently used dashboards to the main menu. You see your saved dashboards under the Starred section on the main menu.
This feature is enabled by default in PMM. You can disable it by disabling the savedItems feature flag if you have server admin or Grafa admin roles.
Tip:
You can follow these steps to add your dashboard to Starred on the main menu:
While looking for a specific metric or panel inside dashboards, it is easy to forget which dashboard presents it. Now you can quickly find the dashboard you need on the Search dashboard page.
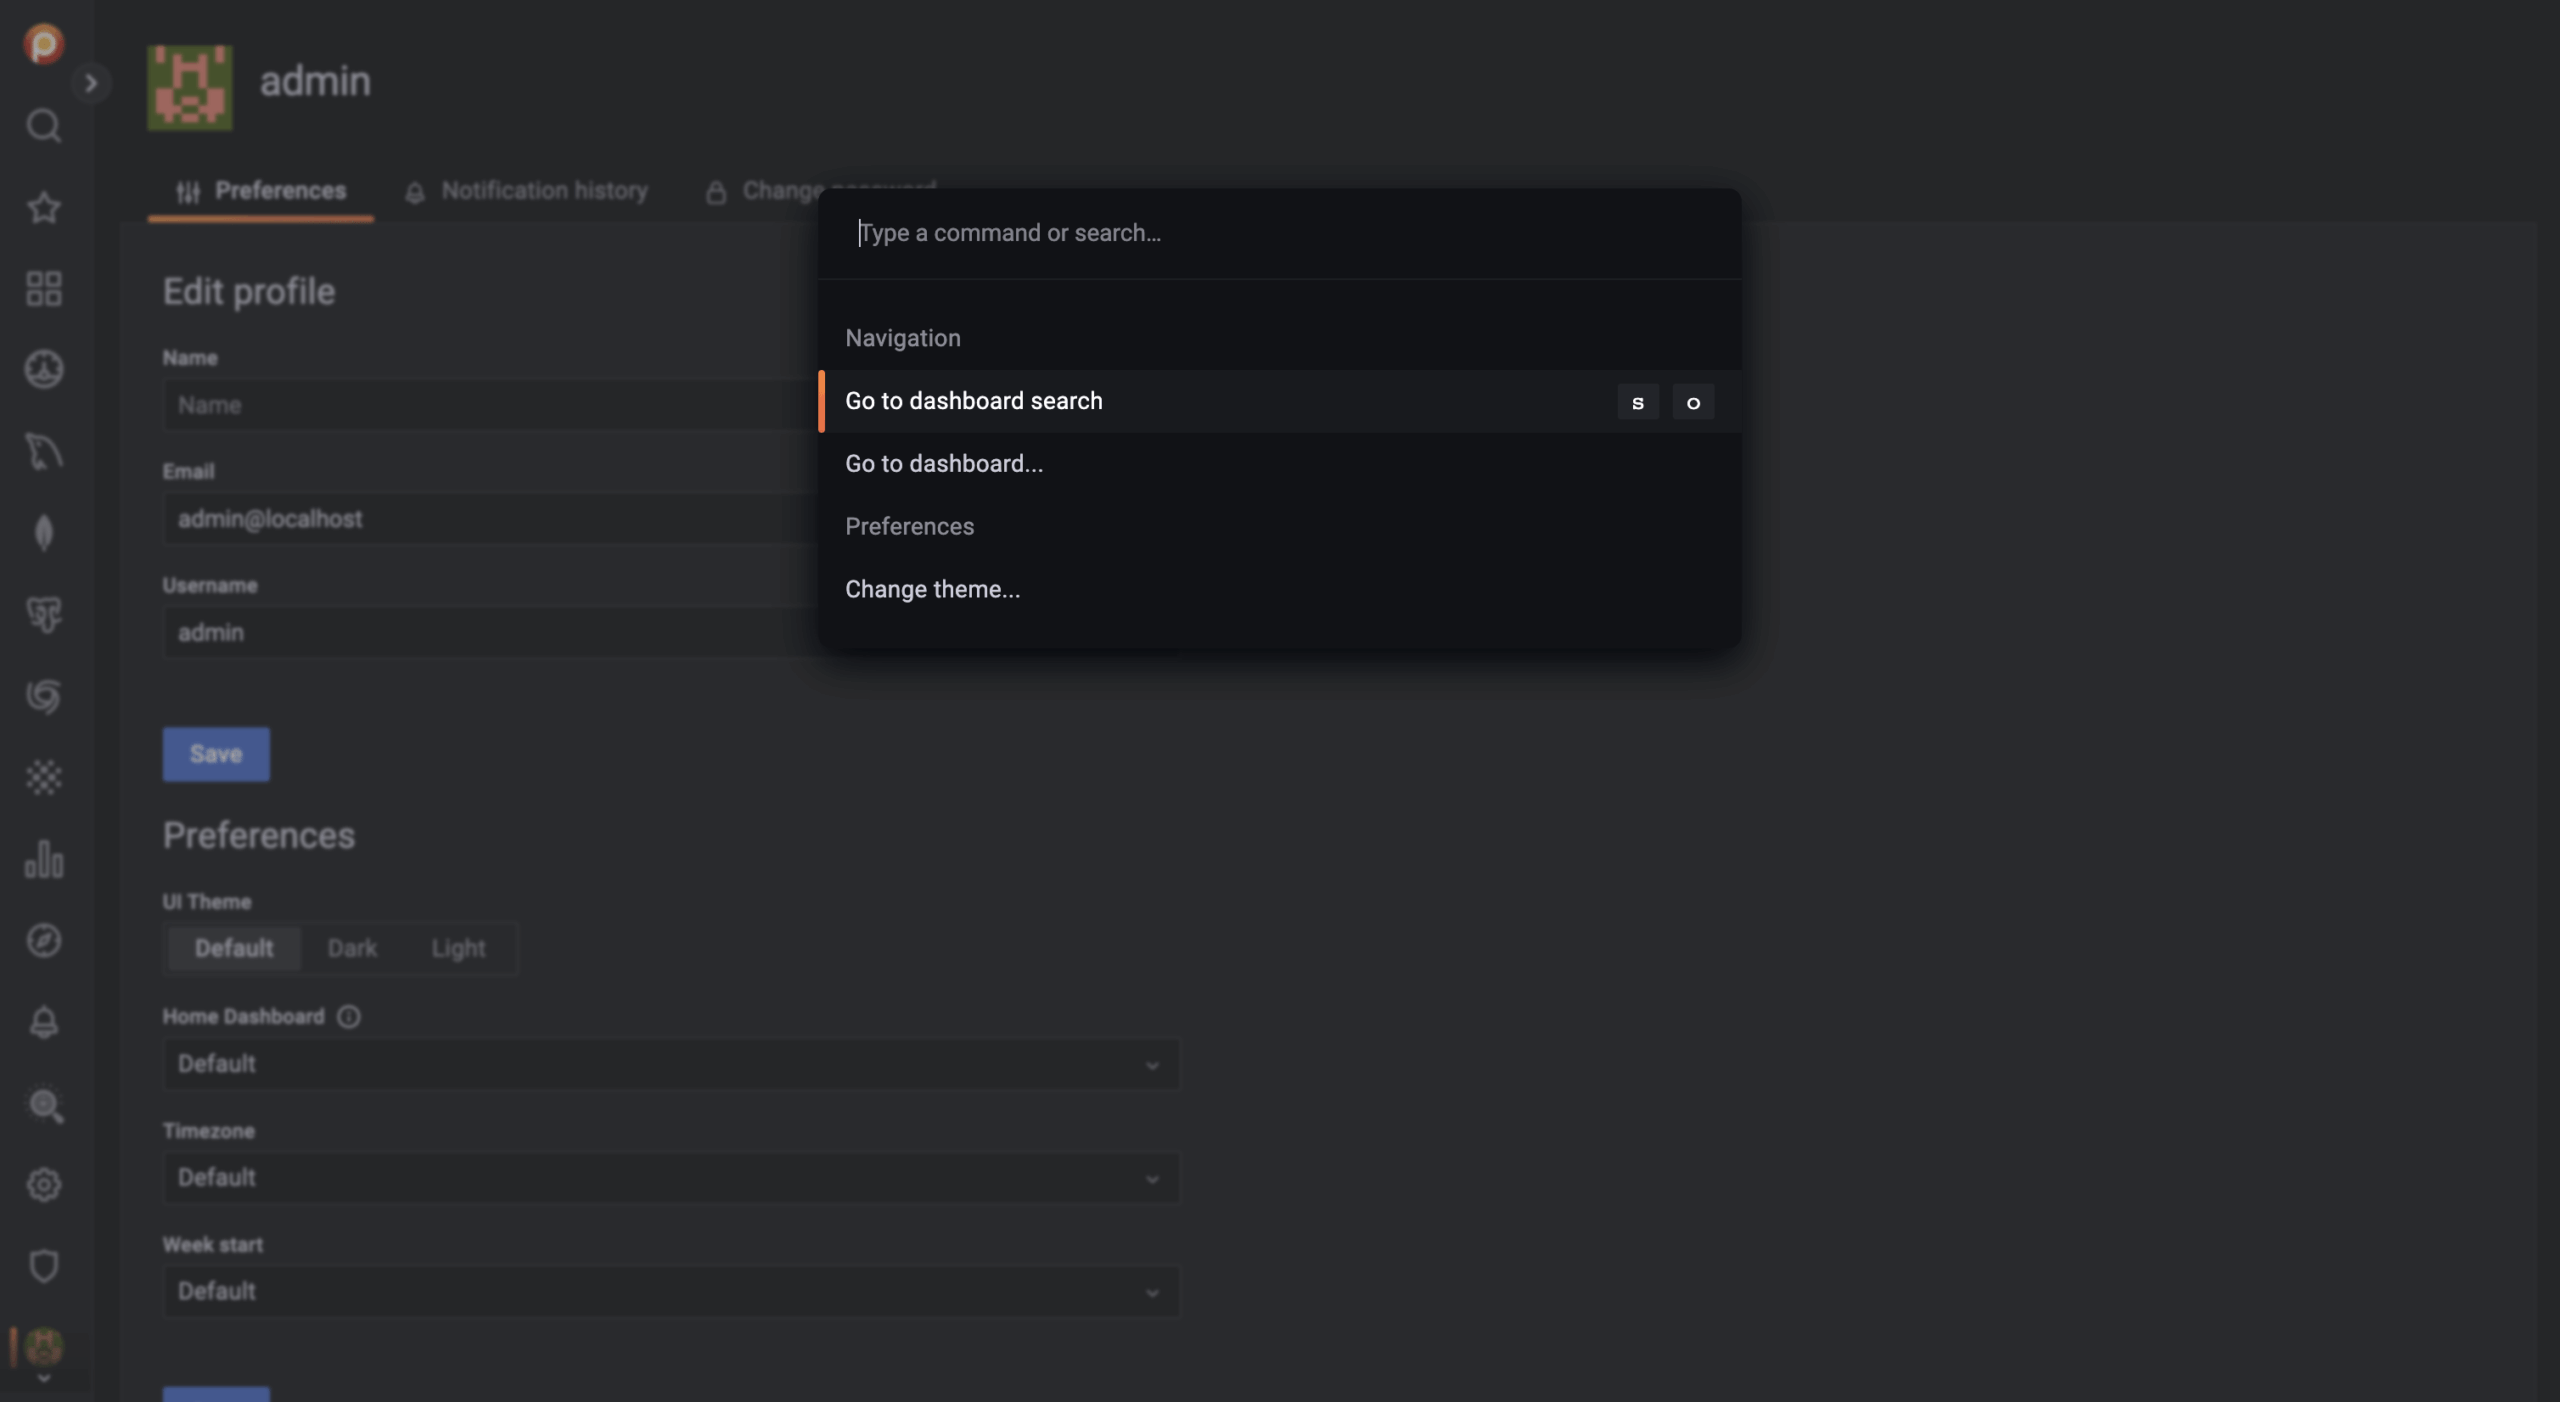
A new shortcut which is named “command palette” in Grafana, has been provided in this PMM version. You can easily access main menu sections, dashboards, or other tasks using cmd+K (MacOS) or ctrl+K (Linux/Windows). Run the command on the Explore section to quickly run a query or on the Preferences section to easily change theme preferences.
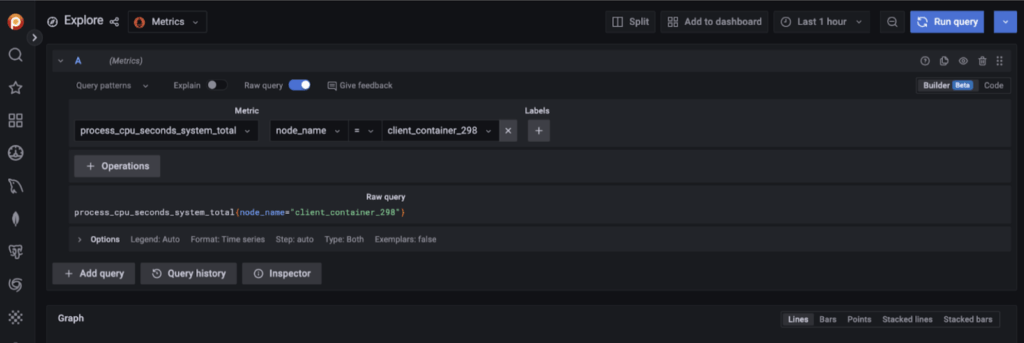
A new Prometheus query builder has been introduced in Grafana 9. This feature allows everyone, especially new users, to build queries on PromQL without extensive expertise. Visual query builder UI in Explore allows anyone to write queries and understand what the query means.
You can easily switch to the new Prometheus query builder (Builder) by clicking on Builder mode in the top-right corner. The Builder mode allows you to build your queries by choosing the metric from the dropdown menu. If you want to continue on Text mode, you can switch to Code mode while having your text changes preserved. Please check this blog to learn more about Builder mode.
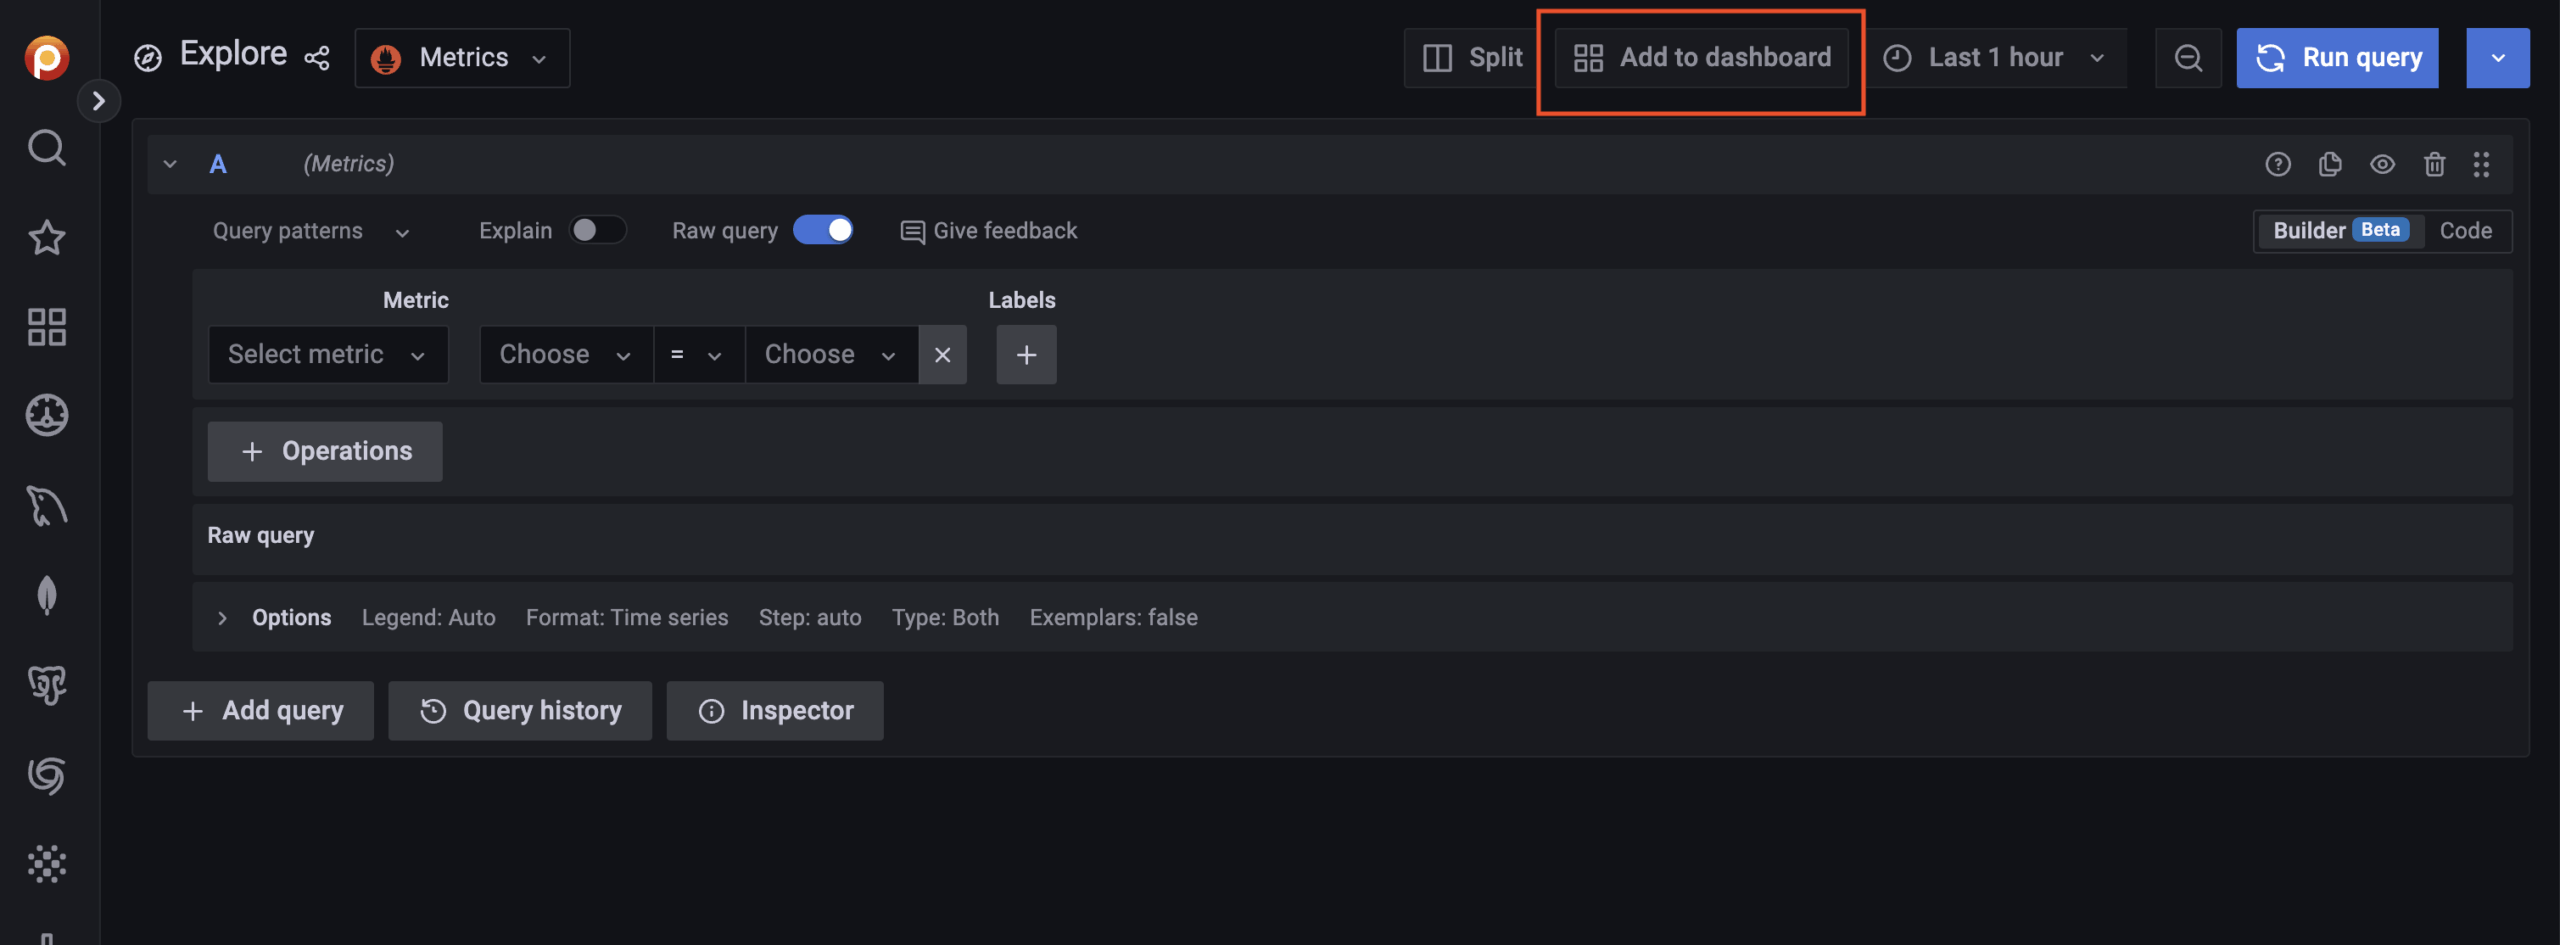
You’ll probably like this news if you’re a fan of the Explore feature or frequently use it. Now, creating a panel/dashboard from Explore with one click is possible by saving you from jobs like copy-paste or re-write queries. You only need to click the “Add to dashboard” button after you run your query. Then, your panel will be automatically created with the query and a default visualization. You can change the visualization on the dashboard later by clicking the “Edit” panel. Note that you need to have the Editor/Admin/SuperAdmin role to save the panel to the chosen dashboard and follow the current dashboard save flow to save the added panel. Otherwise, you’ll lose the added new panel on your dashboard.
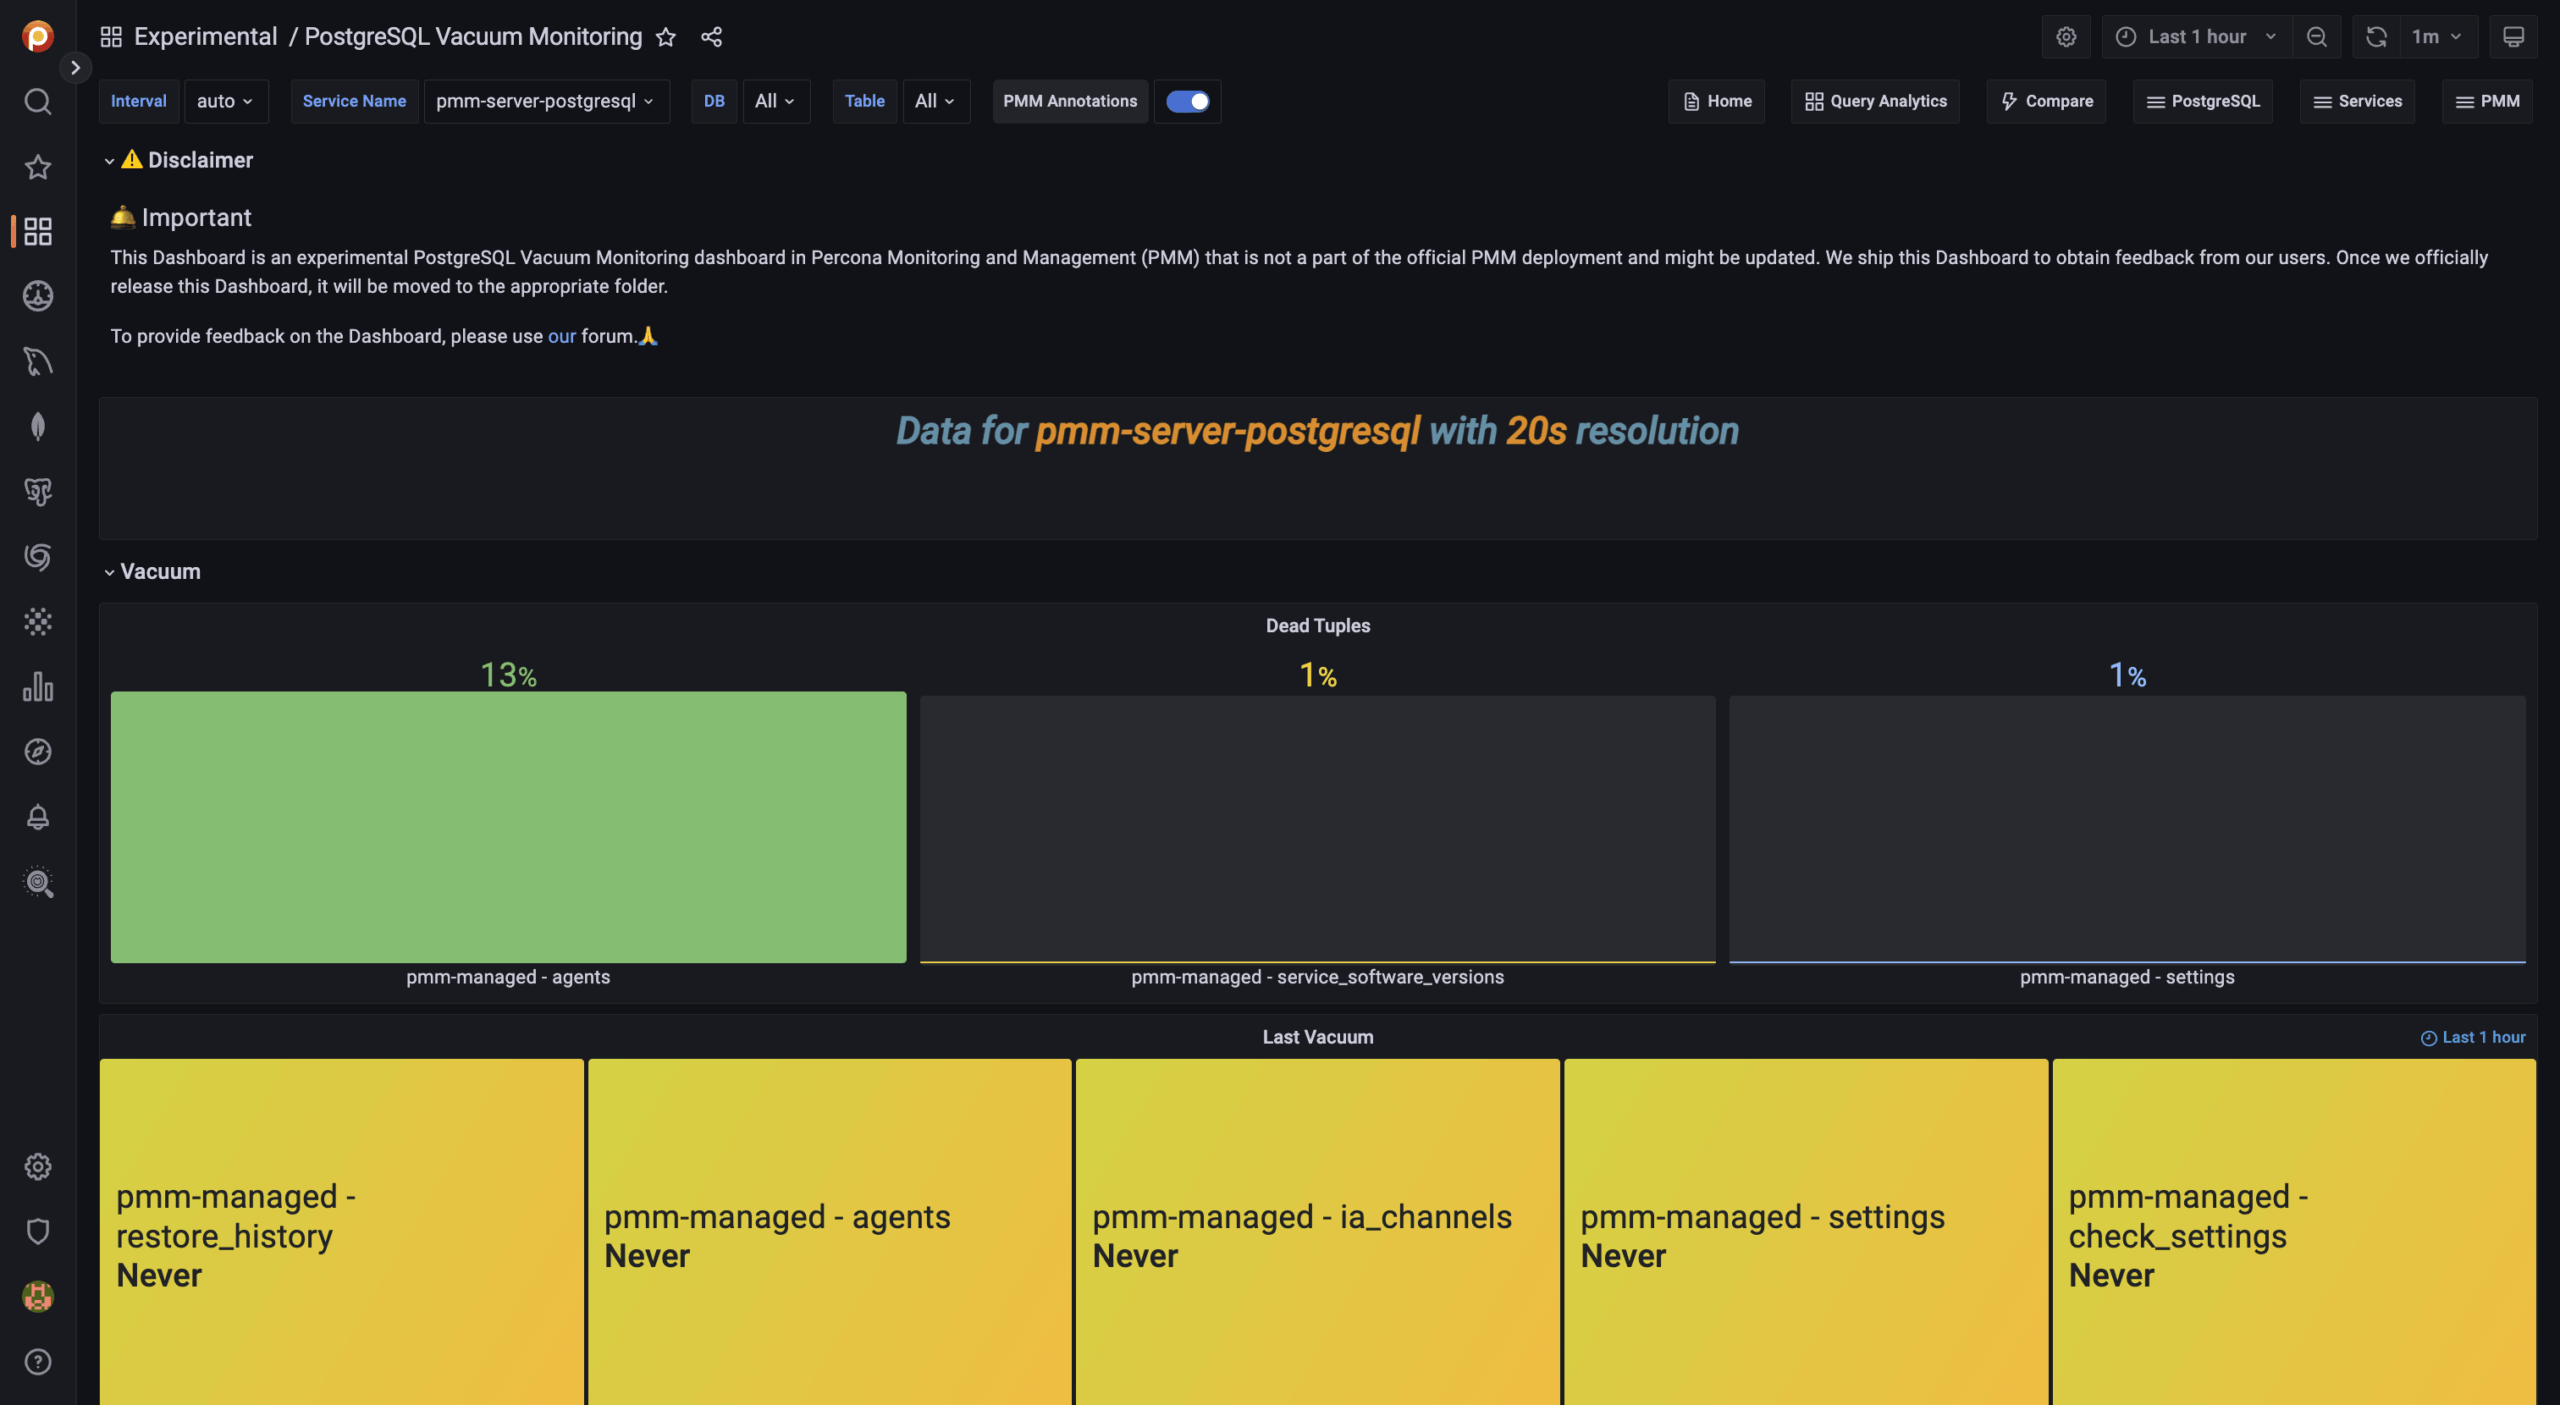
The autovacuum process in PostgreSQL is designed to prevent table bloat by removing dead tuples. These dead tuples can accumulate because of the unique way that PostgreSQL handles MVCC. Because PostgreSQL’s architecture is so unique, the autovacuum process is sometimes not understood well enough to be able to tune its parameters for peak performance. After talking to many customers and realizing that this is a recurring problem, we decided to help our users by providing a dashboard that allows you to monitor metrics related to the vacuum process – thereby helping you tune these parameters for better performance.
Now, you can monitor PostgreSQL vacuum processes with a new experimental dashboard named PostgreSQL Vacuum Monitoring which is available in the Experimental folder. We’re still working on this dashboard to add more metrics. Please let us know your feedback about this dashboard in the comments.
Tip
If you’d like to move the Vacuum experimental dashboard to the PostgreSQL folder or other folders that you internally use to gather all PostgreSQL dashboards, please check this document to see how you can move dashboards to a different folder.
We are excited to announce the General Availability (GA) of Podman support for deploying PMM 2.31.0. We had introduced it in 2.29.0 as a preview feature, but now we are production ready with this feature.
In our constant endeavor and focus on an enhanced user experience, in PMM 2.31.0, we have simplified the deployment and configuration of DBaaS as follows:
We love our community and team in Percona, who help shape PMM and improve better!
Thank you for your collaboration on the new main menu:
Pedro Fernandes, Fábio Silva, Matej Kubinec
Thank you for your collaboration on Vacuum Dashboards:
Anton Bystrov, Daniel Burgos, Jiri Ctvrtka, Nailya Kutlubaeva, Umair Shahid
Percona Monitoring and Management is a best-of-breed open source database monitoring solution. It helps you reduce complexity, optimize performance, and improve the security of your business-critical database environments, no matter where they are located or deployed.
Resources
RELATED POSTS