 The Microsoft Azure SQL Database is among the most popular databases of 2020, according to DB-Engine’s DBMS of the Year award. Also, it’s steadily climbing up in DB-Engines Ranking. The ranking is updated monthly and places database management systems according to their popularity. In case you didn’t know, DB-Engines is an initiative to collect and present information on database management systems (DBMS).
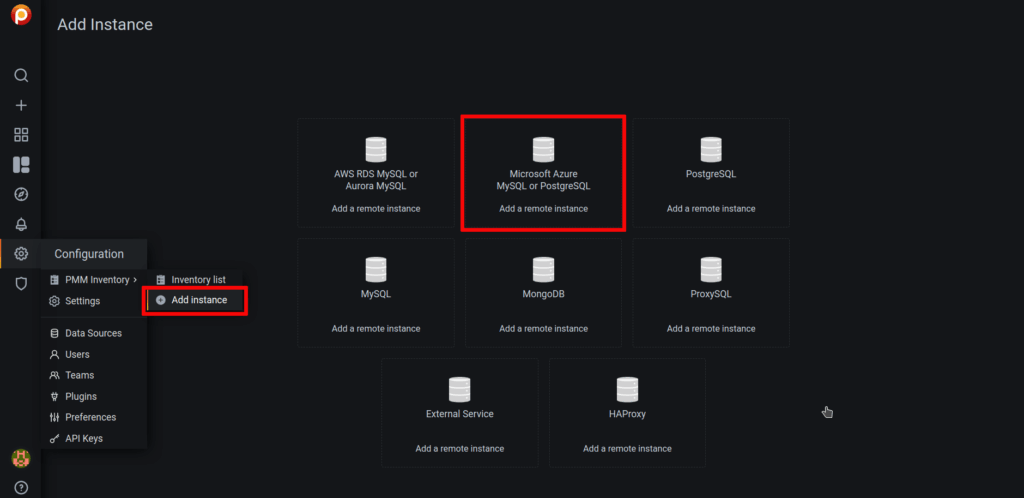
So we are excited to share that you can now monitor Azure instances in the Percona Monitoring and Management 2.16.0 (PMM) release. PMM can collect Azure DB metrics as well as available system metrics.
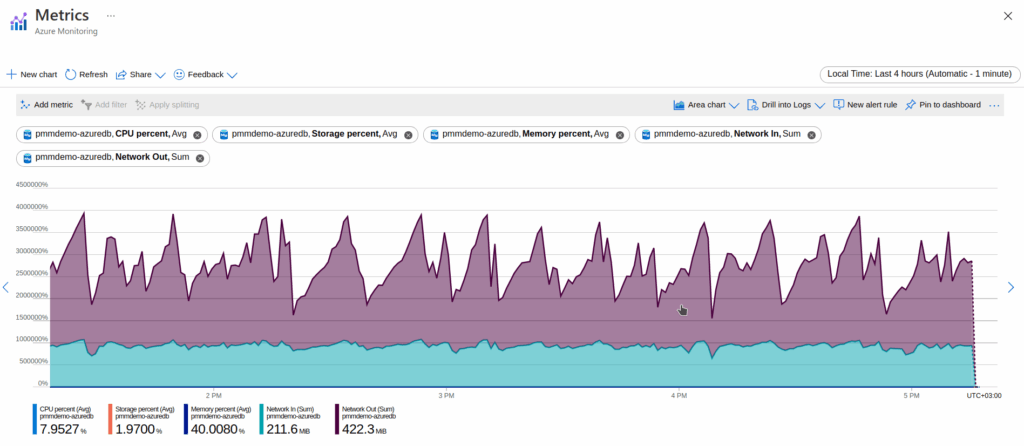
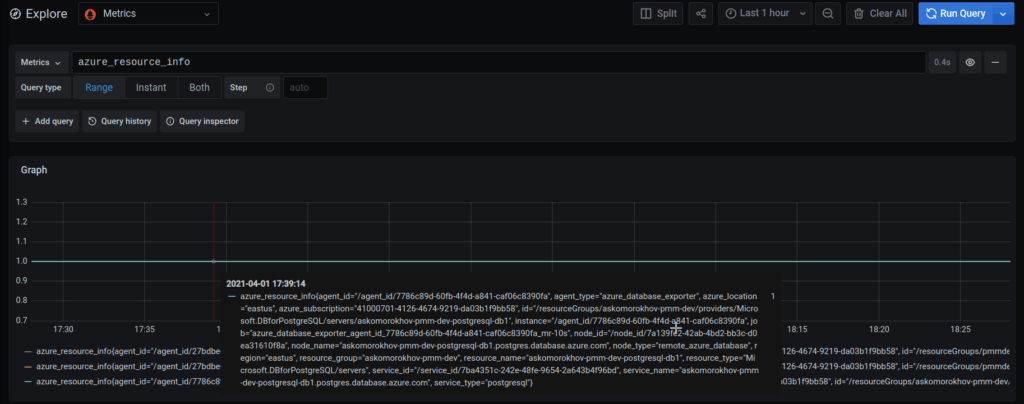
Only basics metrics are provided by Azure Portal.
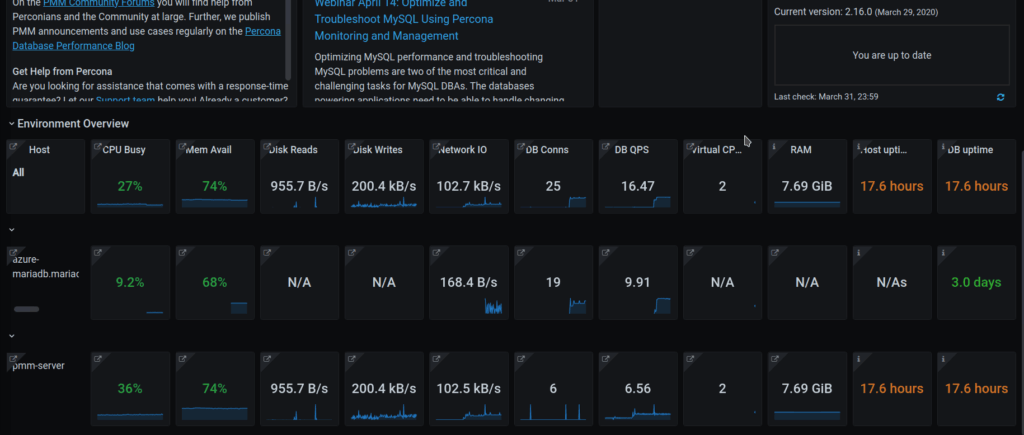
No Disk, virtual CPU, or RAM data are available in PMM dashboards. Here is an example of a home page with a monitored Azure service. It’s shown in the middle row.
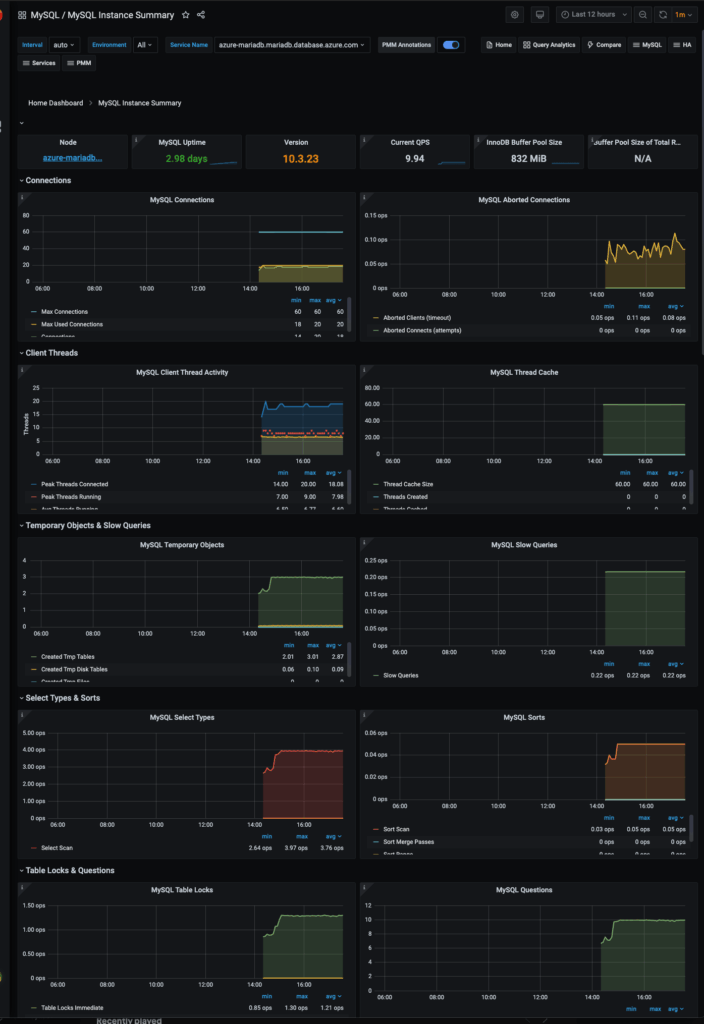
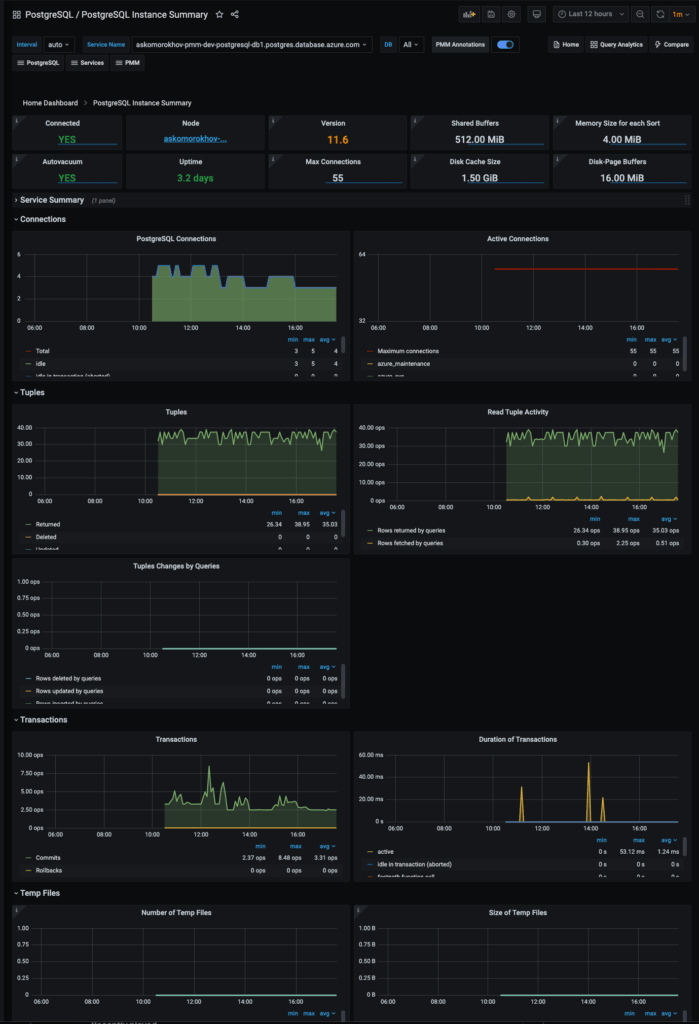
DB metrics are collected by exporters from services directly. It allows you to have all possible metrics. You can find some screenshots of MySQL and PostgreSQL dashboards at the end of this blog post.
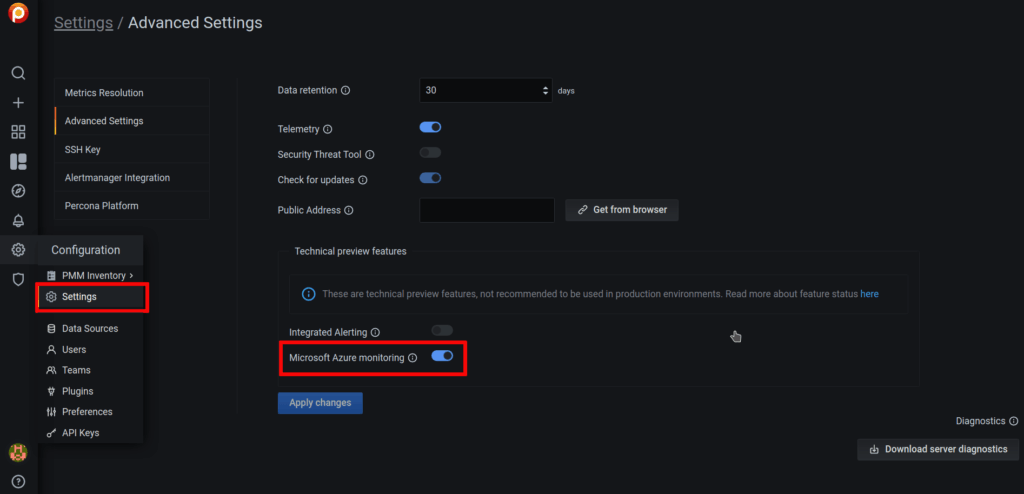
This feature is a technical preview because we are releasing it as soon as possible to get some feedback from users. We are expecting to do more work on this feature, to make it more API and resource-efficient.
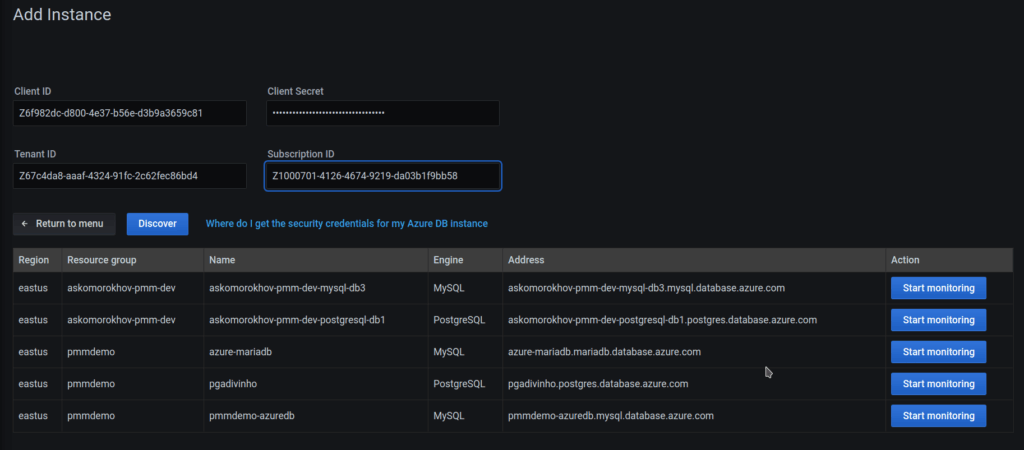
Please follow the link “Where do I get the security credentials for my Azure DB instance” if some credential parameters are missing.
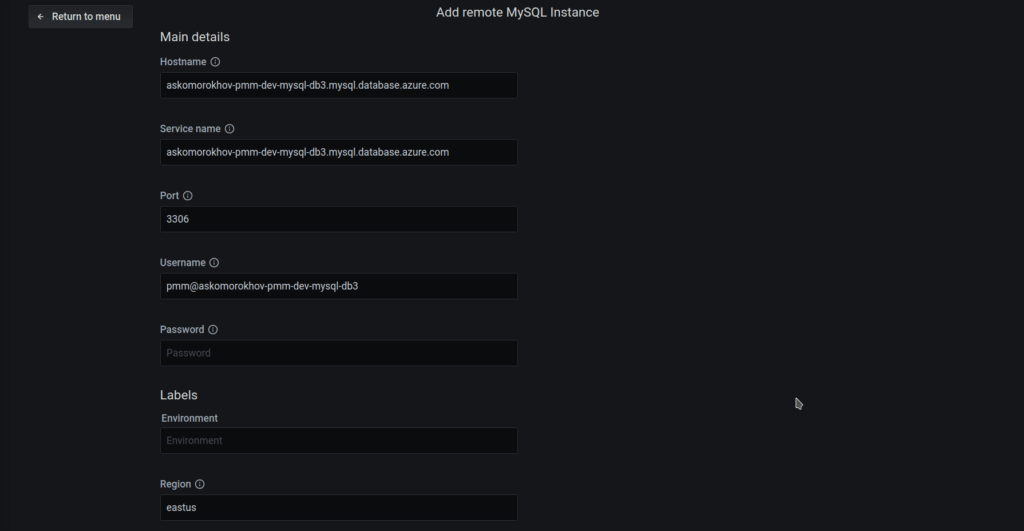
Also, please keep in mind that a separate node will be created for each service. It’s named as a service hostname and can’t be changed. But you may specify a service name when adding service details. By default, node and service names are equal.
That’s it. You may go to the list of dashboards and observe collected data.
If you are a Microsoft Azure user or going to become one, please give Percona Monitoring and Management a test run. We are always open to suggestions and propositions. Please contact us, leave a message on our forum, or join the slack channel.
Here are screenshots of the “MySQL Instance Summary” and “PostgreSQL Instance Summary” dashboards for Azure instances.
Read more about the release of Percona Monitoring and Management 2.16 and all the exciting new features included with it!
Percona Live ONLINE, the open source database conference, is coming up quickly! Registration is now OPEN… and FREE!
Resources
RELATED POSTS