
Percona XtraDB Cluster 8.0 is in the final stretch before GA release and we have pre-release packages available for testing, and I wanted to see how Percona XtraDB Cluster 8.0 performs in CPU and IO-bound scenarios, like in my previous posts about MySQL Group Replication.
In this blog, I want to evaluate Percona XtraDB Cluster 8.0 scaling capabilities in I/O bound cases when we increase the number of nodes and increase user connections. The version I used is available here: Percona-XtraDB-Cluster-8.0.18.
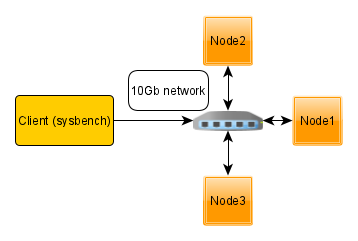
For this testing, I deploy multi-node bare metal servers, where each node and client are dedicated to an individual server and connected between themselves by a 10Gb network.
Hardware specifications:
|
1 2 3 4 5 6 7 8 9 10 11 12 13 14 |
System | Supermicro; SYS-F619P2-RTN; v0123456789 (Other) Platform | Linux Release | Ubuntu 18.04.4 LTS (bionic) Kernel | 5.3.0-42-generic Architecture | CPU = 64-bit, OS = 64-bit Threading | NPTL 2.27 SELinux | No SELinux detected Virtualized | No virtualization detected # Processor ################################################## Processors | physical = 2, cores = 40, virtual = 80, hyperthreading = yes Models | 80xIntel(R) Xeon(R) Gold 6230 CPU @ 2.10GHz Caches | 80x28160 KB # Memory ##################################################### Total | 187.6G |
For the benchmark, I use sysbench-tpcc 1000W prepared database as:
|
1 |
./tpcc.lua --mysql-host=172.16.0.11 --mysql-user=sbtest --mysql-password=sbtest --mysql-db=sbtest --time=300 --threads=64 --report-interval=1 --tables=10 --scale=100 --db-driver=mysql --use_fk=0 --force_pk=1 --trx_level=RC prepare |
The configs, scripts, and raw results are available on our GitHub. The workload is “I/O-bound”, that is data (about 100GB) does not fit into innodb_buffer_pool (25GB) and there are intensive read/write IO operations.
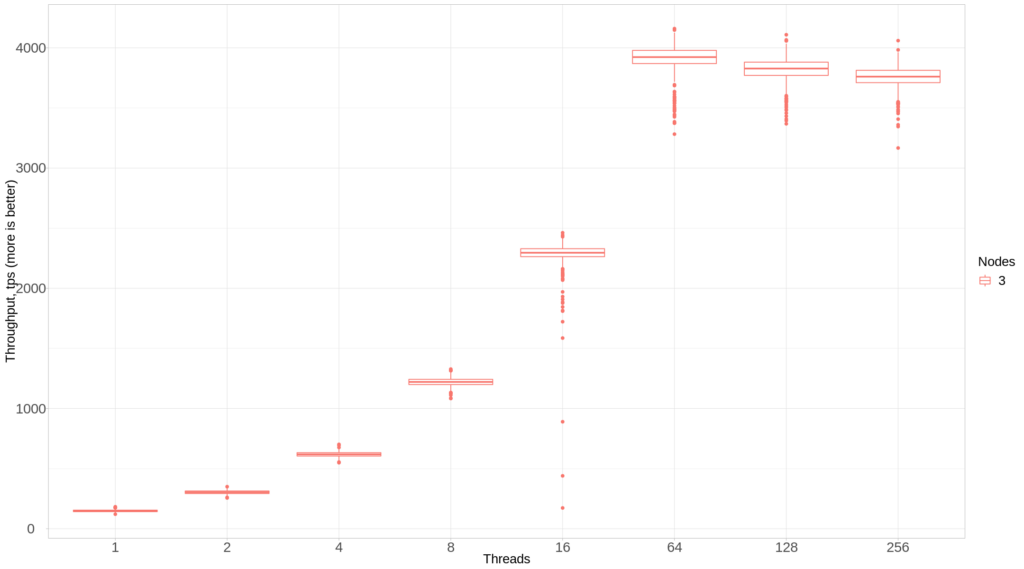
Let’s review the results I’ve got. First, let’s take a look at how the performance changes when we increase user threads from 1 to 256 for 3 nodes.
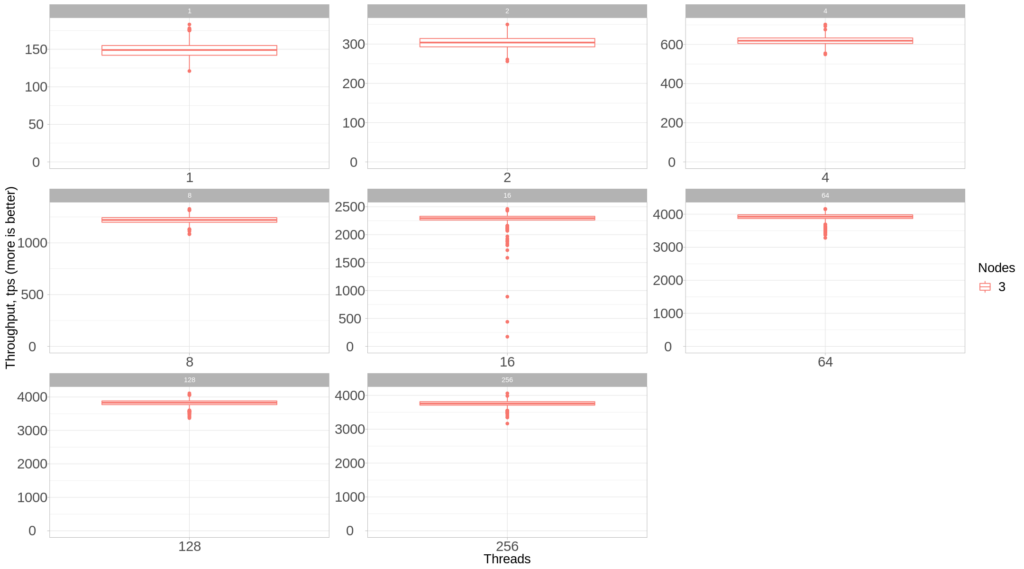
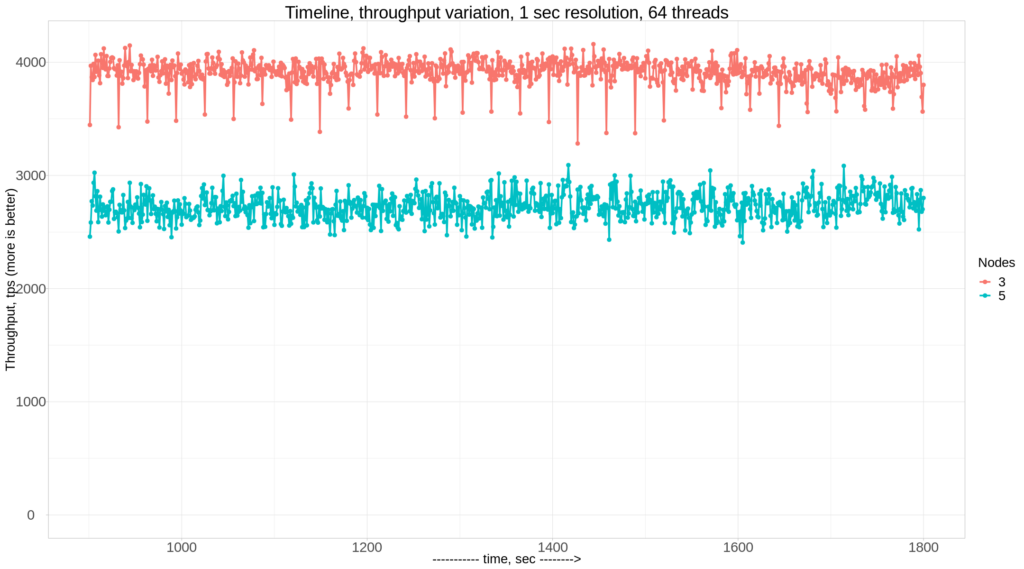
To see the density of the results in more detail, let’s draw the chart with the individual scales for each set of threads:
Now let’s look at the performance under 5 nodes (compared to 3 nodes):
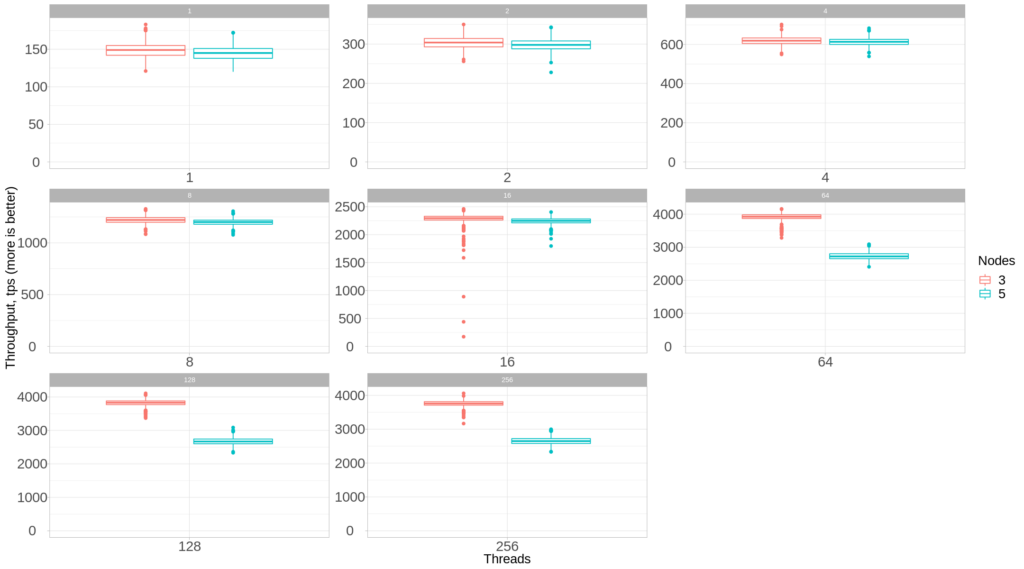
3 nodes vs 5 nodes:
Now as we have both results for Percona XtraDB Cluster and Group Replication, we can compare how they perform under identical workloads. In this case, we compare 3 nodes setup:
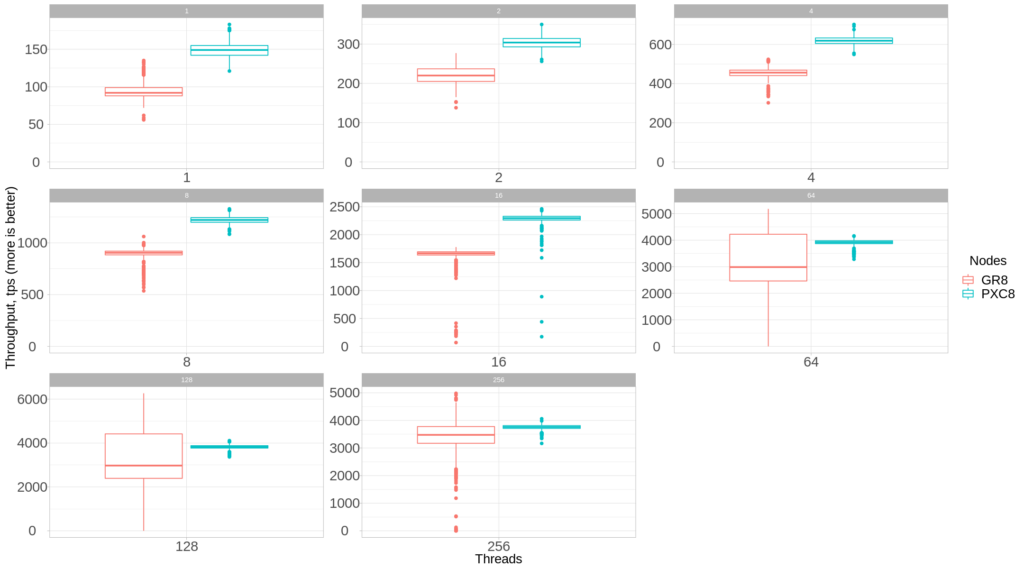
We can see that Percona XtraDB Cluster consistently shows better average throughput, with much less variance, compared to Group Replication.
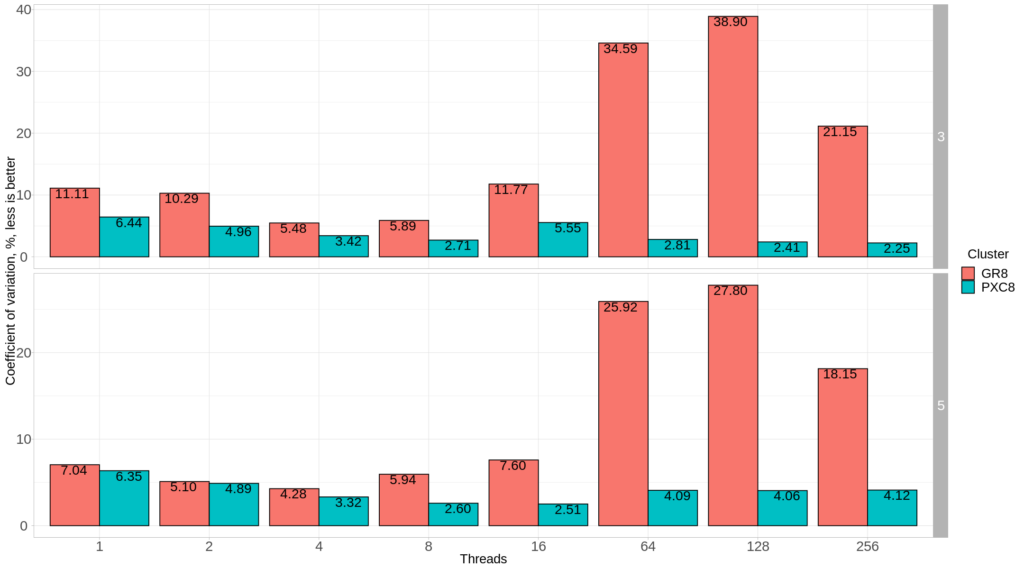
Let’s calculate a coefficient of variation for both Percona XtraDB Cluster and Group Replication, for 3 nodes and 5 nodes setups.
I want to use a coefficient of variation instead of standard deviation because standard deviation operates in absolute values and it is hard to compare the standard deviation between 1 and 128 threads. A coefficient of variation shows a variation in percentage (standard deviation relative to average value) – the smaller value will correspond to less variance, and less variance is better.


Can you do a comparison between PXC 5.7 and PXC 8?