
 We are pleased to announce our 7th Beta release of PMM 2! Percona Monitoring and Management (PMM) is a free and open-source platform for managing and monitoring MySQL, MongoDB, and PostgreSQL performance. This release includes the following improvements:
We’ve also updated our core software to:
PMM 2 is still a work in progress — you may encounter some bugs and missing features. We are aware of a number of issues, but please report any and all that you find to Percona’s JIRA.
This release is not recommended for production environments. PMM 2 is designed to be used as a new installation — please don’t try to upgrade your existing PMM 1 environment.
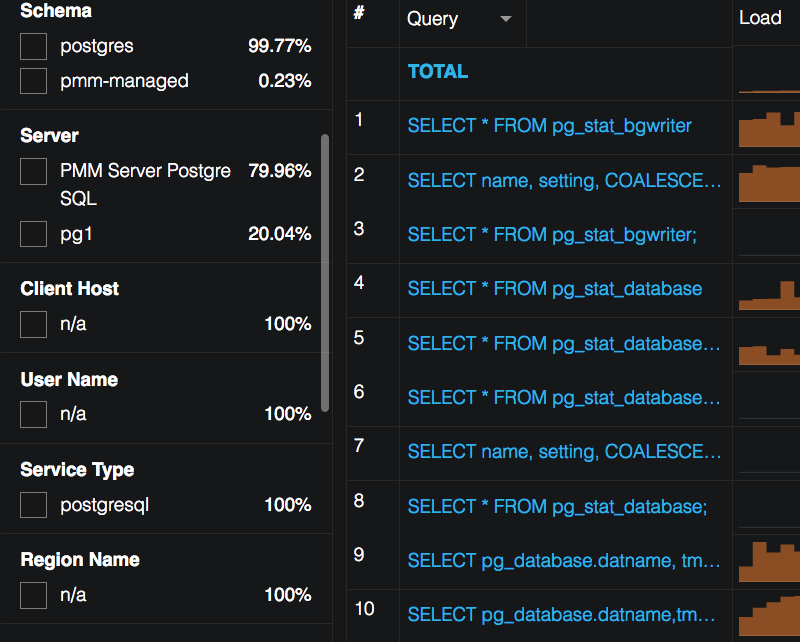
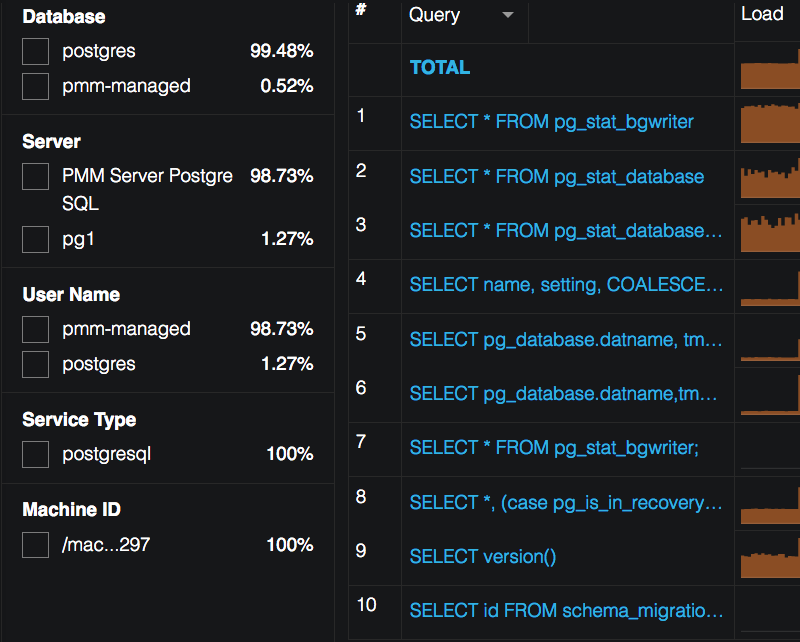
The filter panel now only shows labels that have meaningful select options. Compare the old layout (on the left) with the new one (on the right):
 |
 |
|---|
In cases where a field is blank but we know activity is occurring i.e. Client Host is not available from MySQL Performance Schema data source, we use n/a as a placeholder, and we don’t display the option (see example above – Client Host on left, not displayed on the right). In cases where actual values exist as well as n/a, we display all available options.
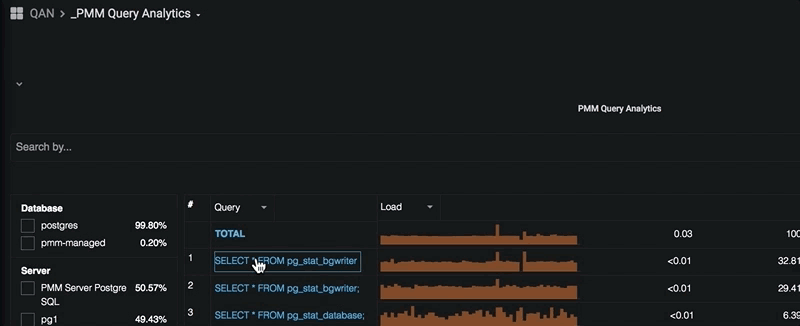
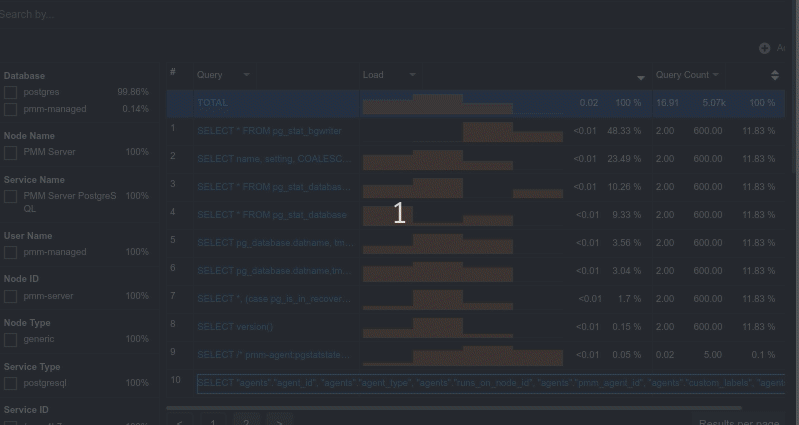
Also, the details section was also improved to display % from Total for every Metric of the selected query:
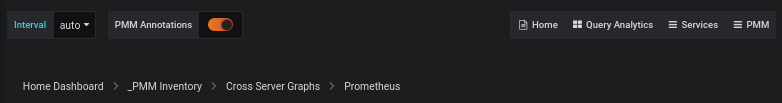
This new panel tracks all dashboards you have visited within one session starting from the root (which is either the Home dashboard or Services Overview dashboard) and displays them as a clickable breadcrumb:
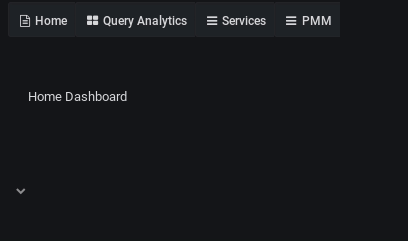
In this release, we introduce a restructured menu with a correspondent change in the dashboards’ taxonomy. Now dashboards belong to one of the following groups:
Along with this rearrangement, we have a new main menu. Below is the new look for its top-level:
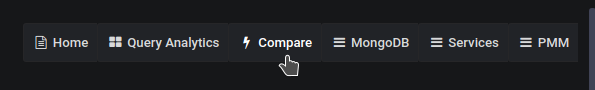
Selecting a specific service (MySQL, MongoDB, PostgreSQL, etc.) will guide you to the next level of the hierarchy, where you can access Details Dashboards related to this Service, or a Service Compare Dashboard:
As already noted, we have introduced Services Compare Dashboards for all of the services supported by PMM, with the “Compare” menu item available when a specific service is selected.
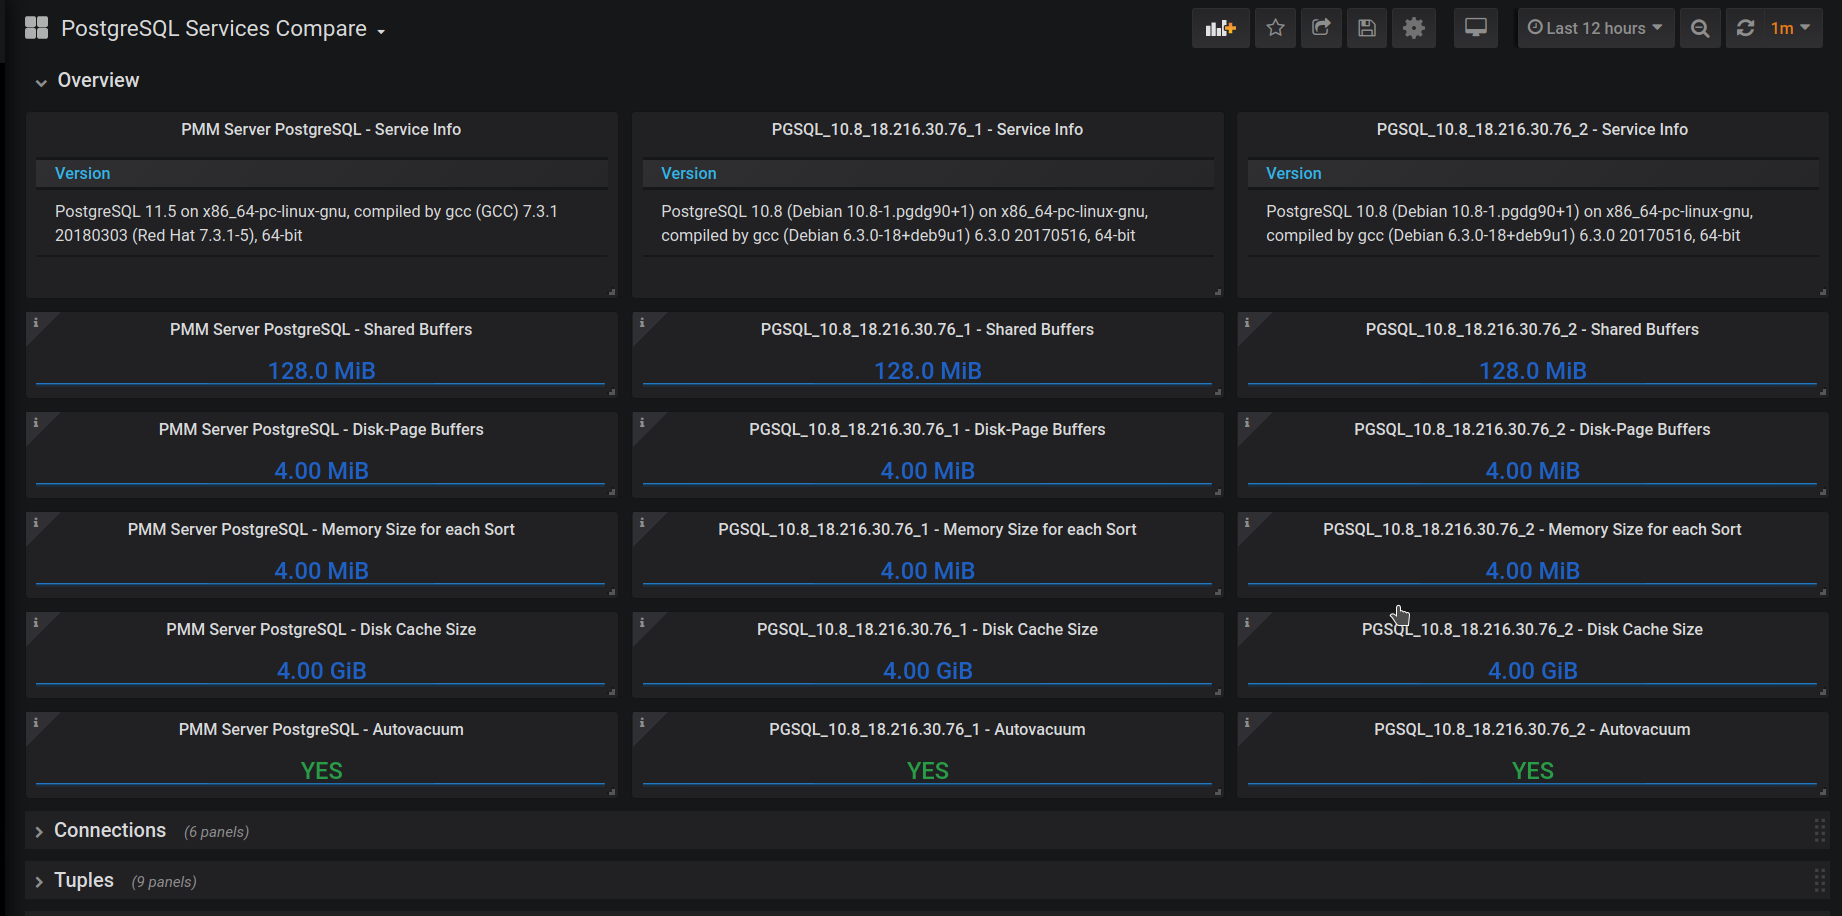
The following image shows the dashboard which allows you to compare available PostgreSQL Services:
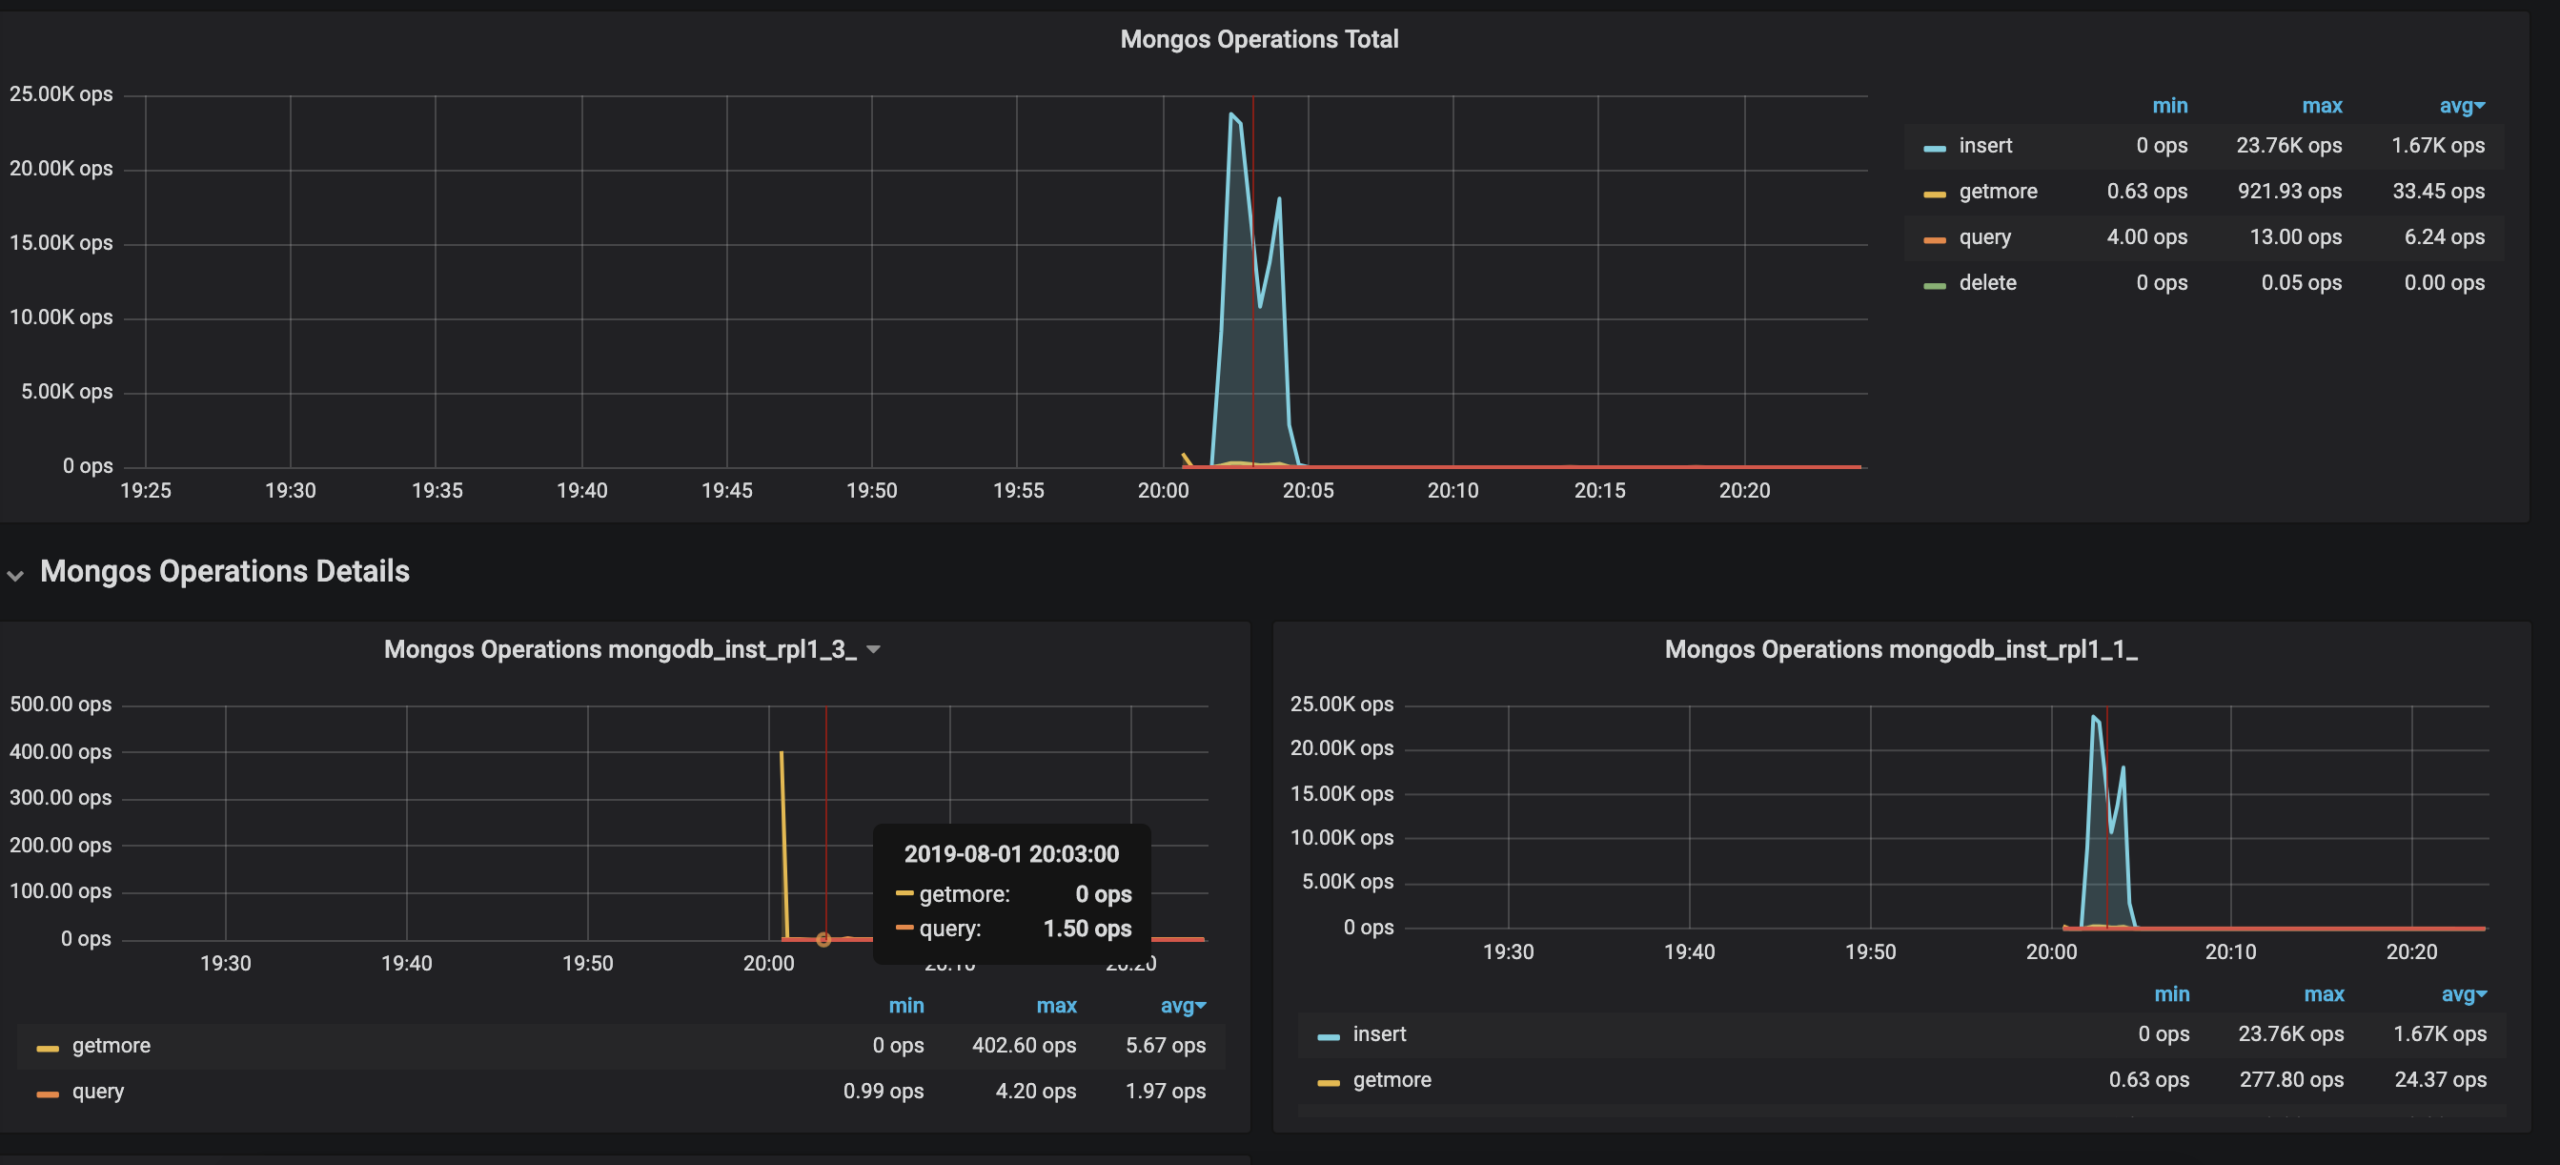
MongoDB Cluster Summary dashboard has got an update, showing metrics data split by services they are related to in addition to the total metrics data:
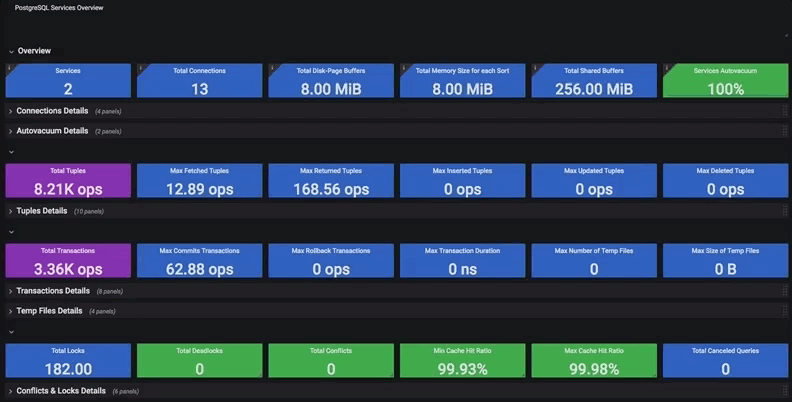
PostgreSQL Services Overview dashboard has got an update, showing metrics data split by services they are related to in addition to the total metrics data:
Several small dashboard improvements were made in this release. The following two improvements are the most noticeable.
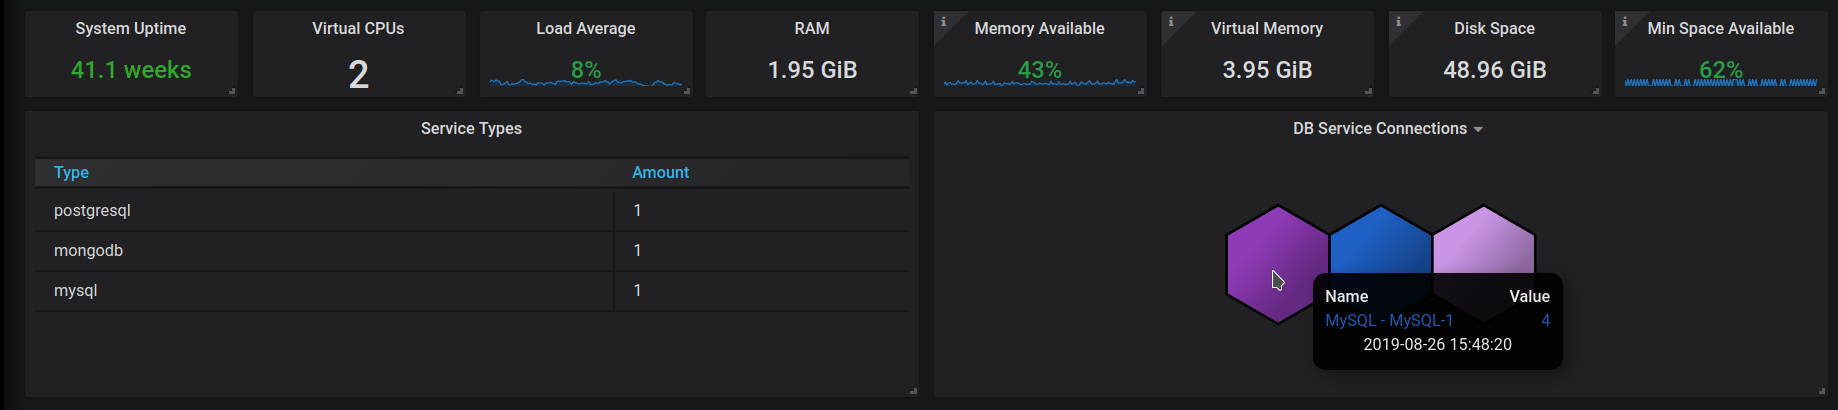
The System Overview Dashboard has obtained two new elements describing available service types and database service connections:
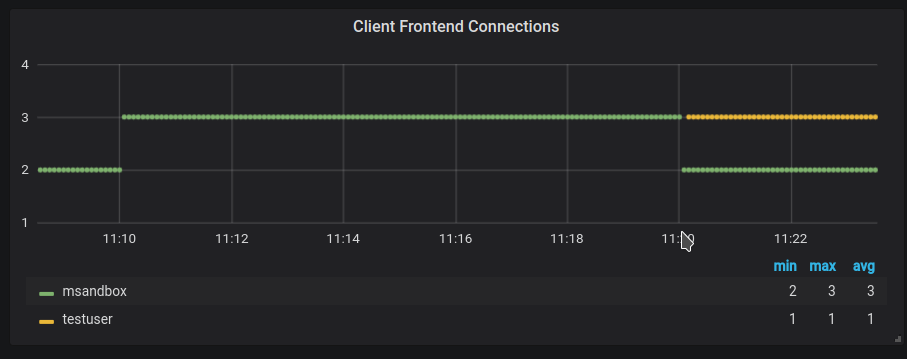
The ProxySQL Overview Dashboard now contains a chart with information about client connections:
We’re also incrementally improving our Dashboards with the addition of Tooltips. This release we’ve updated the InnoDB Compression dashboard.

Beginning with Beta 7’s release, PMM can monitor remote database instances without installing any local agents. Note that node resource information will be missing (no CPU/Network/Disk/Memory) since these metrics are only available when a local agent is installed.
Grafana now handles authentication between PMM Server and PMM Client. In particular, PMM Client should be configured to connect to a PMM Server with the admin default user credentials as follows (note the --server-url string change):
|
1 |
sudo pmm-admin config --server-insecure-tls --server-url=https://admin:admin@<IP Address> |
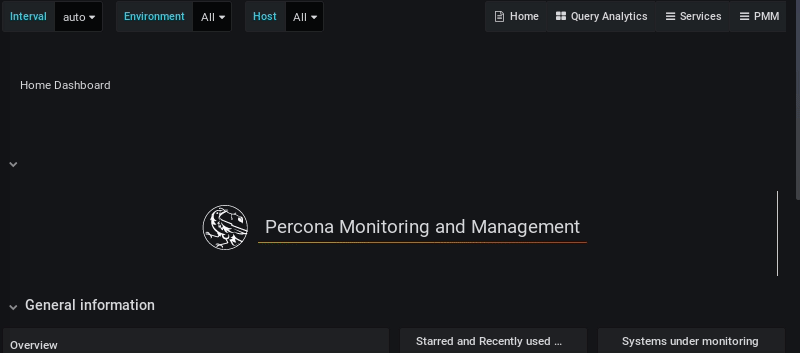
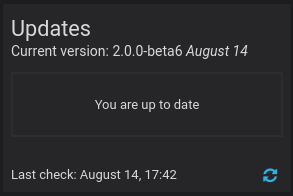
The current version and the available update can be seen on the Updates panel on the Home dashboard:
The easiest way to install PMM Server is to deploy it with Docker. Running the PMM 2 Docker container with PMM Server can be done by the following commands (note the version tag of 2.0.0-beta7):
|
1 2 |
docker create -v /srv --name pmm-data-2-0-0-beta7 perconalab/pmm-server:2.0.0-beta7 /bin/true docker run -d -p 80:80 -p 443:443 --volumes-from pmm-data-2-0-0-beta7 --name pmm-server-2.0.0-beta7 --restart always perconalab/pmm-server:2.0.0-beta7 |
Now you can check the newly installed PMM Server in your browser, going to your server by its IP address. PMM Server provides user access control, and therefore you will need user credentials to access it:
The default PMM Server credentials are:
username: admin
password: admin
You will be prompted to change the admin password after logging in.
Since PMM 2 is still not GA, you’ll need to leverage our experimental release of the Percona repository. You’ll need to download and install the official percona-release package from Percona and use it to enable the Percona experimental component of the original repository. See percona-release official documentation for further details on this new tool.
Specific instructions for a Debian system are as follows:
|
1 2 |
wget https://repo.percona.com/apt/percona-release_latest.generic_all.deb sudo dpkg -i percona-release_latest.generic_all.deb |
Now enable the experimental repo:
|
1 2 |
sudo percona-release disable all sudo percona-release enable original experimental |
Install pmm2-client package:
|
1 2 |
apt-get update apt-get install pmm2-client |
Users who have previously installed pmm2-client alpha version should remove the package and install a new one in order to update to beta1.
Please note that leaving experimental repository enabled may affect further package installation operations with bleeding-edge software that may not be suitable for Production. You can revert by disabling experimental via the following commands:
|
1 2 |
sudo percona-release disable original experimental sudo apt-get update |
Once PMM Client is installed, run the pmm-admin config command with your PMM Server IP address to register your Node:
Note that you need to pass the authentication string as part of the --server-url. We’ll be fixing this in a later release when instead we’ll accept as separate parameters. These credentials are the same ones you have used to login to PMM Server, so pass the default password or the new one if you have changed it in the login screen.
|
1 |
# pmm-admin config --server-insecure-tls --server-url=https://admin:admin@<IP Address> |
You should see the following:
|
1 2 3 4 5 6 7 |
Checking local pmm-agent status... pmm-agent is running. Registering pmm-agent on PMM Server... Registered. Configuration file /usr/local/percona/pmm-agent.yaml updated. Reloading pmm-agent configuration... Configuration reloaded. |
MySQL server can be added for monitoring in its normal way. Here is a command which adds it using the PERFORMANCE_SCHEMA source:
|
1 |
pmm-admin add mysql --query-source='perfschema' --username=pmm --password=pmm |
where username and password are credentials for the monitored MySQL access, which will be used locally on the database host.
The syntax to add MySQL services (Metrics and Query Analytics) using the Slow Log source is the following:
|
1 |
pmm-admin add mysql --query-source='slowlog' --username=pmm --password=pmm |
When the server is added, you can check your MySQL dashboards and Query Analytics in order to view its performance information!
You can add MongoDB services (Metrics and Query Analytics) with a similar command:
|
1 |
pmm-admin add mongodb --use-profiler --username=pmm --password=pmm |
You can add PostgreSQL service as follows:
|
1 |
pmm-admin add postgresql --username=pmm --password=pmm |
You can then check your PostgreSQL Overview dashboard.
You can add ProxySQL service as follows:
|
1 |
pmm-admin add proxysql --username=admin --password=admin |
You can then check your ProxySQL Overview dashboard.
Percona Monitoring and Management (PMM) is a free and open-source platform for managing and monitoring MySQL®, MongoDB®, and PostgreSQL® performance. You can run PMM in your own environment for maximum security and reliability. It provides thorough time-based analysis for MySQL, MongoDB, and PostgreSQL servers to ensure that your data works as efficiently as possible.
Help us improve our software quality by reporting any Percona Monitoring and Management bugs you encounter using our bug tracking system.
Resources
RELATED POSTS


Awesome improvements, thanks for keep building a great tool