
See part one of this series here.
This post is part two of my series “Assessing MySQL Performance Amongst AWS Options”, taking a look at how current Amazon RDS services – Amazon Aurora and Amazon RDS for MySQL – compare with Percona Server with InnoDB and RocksDB engines on EC2 instances. This time around, I am reviewing the total cost of one test run for each database as well as seeing which databases are the most efficient.
First, a quick recap of the evaluation scenario:
For these evaluations, we use the sysbench/tpcc LUA test with a scale factor of 500 warehouses/10 tables. This is the equivalent of 5000 warehouses of the official TPC-C benchmark.
These are the AWS MySQL environments under analysis:
These general notes apply across the board:
And we believe that these configuration notes allow for a fair comparison of the different technologies:
Finally, here are the individual server configurations per environment:
Common to all tests, we used an EC2 instance: m5.xlarge. And now that we have established the setup, let’s take a look at what we found.
Now we are getting down to the $’s! First, let’s review the total cost of one test run for each database:
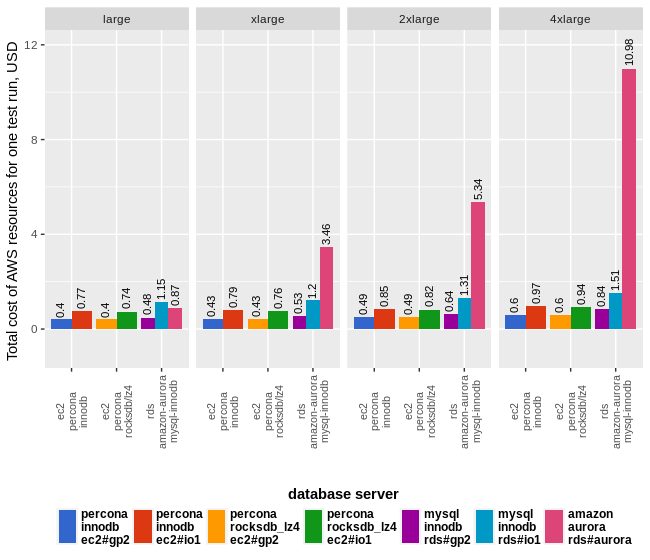
Sorting the costs of one test run in order from cheapest to most expensive we see this order emerge:
How does that translate to $’s? Let’s find out how the structure of these costs looks like for every database. Before we study that, though, there are some things to bear in mind:
These are the formulas we used in calculating these costs:
Here are our calculations in chart form, you can click on the chart to enlarge it on screen:
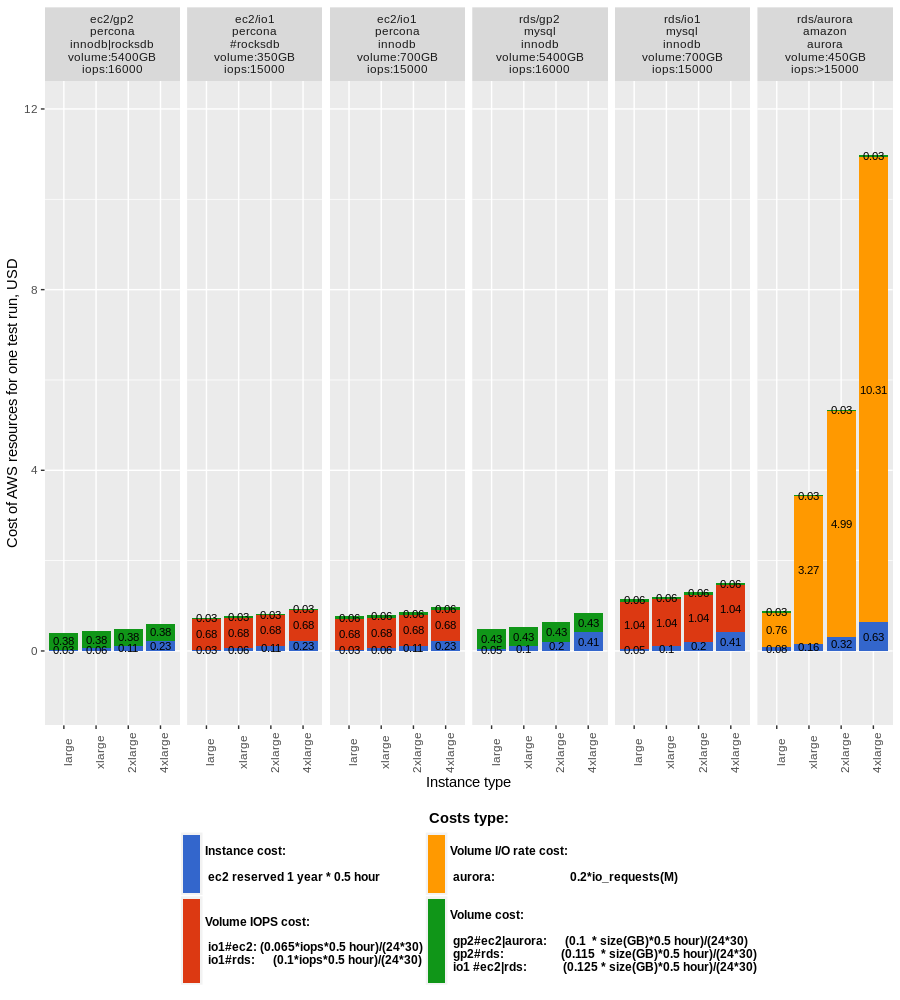
One interesting observation here is that, as you can see from the costs structure chart, the most significant part of costs is IO provisioning – either the requested amount of IOPS (EC2/io1 or RDS/io1) or the actually used amount of IOPS (RDS/Aurora). In the former case, the cost is a function of time, and in the latter case, costs depend only on the amount of I/O requests actually issued.
Let’s check how these costs might look like if we provision EC2/io1, RDS/io1 volumes and RDS/aurora storage for one month. From the cost structure, it’s clear that in case of RDS/aurora 4xlarge – db instance performed 51M I/O requests for half an hour. So we effectively got 51000000 (I/O request) / 1800(seconds) ~= 28000 IOPs.
|
1 2 3 |
EC2/io1: (28000 (IOPS) * 0.065(IOPs price) * 24(hours)*30(days)/(24(hours)*30(days)) 1820$ RDS/io1: (28000 (IOPS) * 0.1(IOPs price) * 24(hours)*30(days)/(24(hours)*30(days)) 2800$ RDS/aurora: 102M(I/O per hour) * 0.2(I/O req price) * 24(hours)*30(days) 14688$ |
In this way, IO provisioning of 28000 IOPS for EC2/io1 costs 8x less and for RDS/io1 costs 5x less. That means that to be cost-efficient, the throughput of RDS/Aurora should be at least 5x or even 8x better than that of EC2 or RDS with io1 volume.
Conclusion: the IO provisioning factor should be taken into account during your planning of deployments with io1 volumes or RDS/aurora
Now it’s time to review which databases perform the most efficiently by analyzing their transaction/cost ratio:
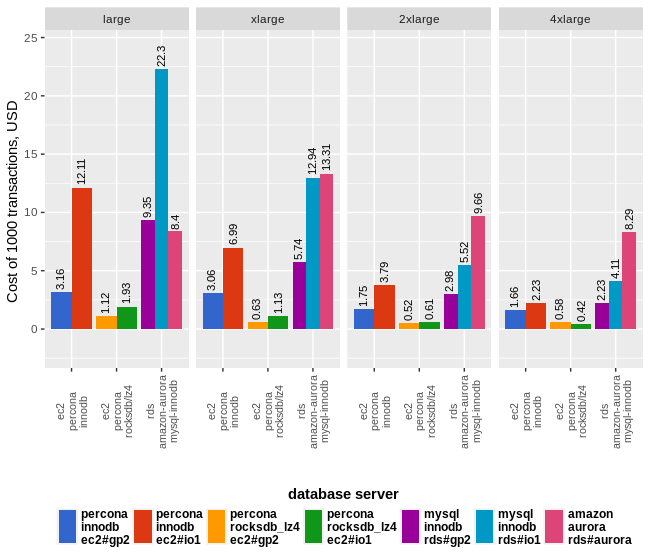
Below you can find the minimum and maximum prices for 1000 transactions for each of the database servers in our tests, again running from cheapest to most expensive in $ terms:
| Server | Min $’s per 1000 TX | Server Config | Min $’s per 1000 TX | Server Config |
|---|---|---|---|---|
| Server test #4 EC2#Percona Server/RocksDB | 0.42 | 4xlarge/io1 | 1.93 | large/io1 |
| Server test #3 EC2#Percona Server/InnoDB | 1.66 | 4xlarge/gp2 | 12.11 | large/io1 |
| Server test #2 RDS#MySQL/InnoDB | 2.23 | 4xlarge/gp2 | 22.3 | large/io1 |
| Server test #1 RDS#Amazon Aurora | 8.29 | 4xlarge | 13.31 | xlarge |
When estimating your expenses, you will need to keep in mind that each company is different in terms of what they offer, how they build and manage those offerings, and of course, their pricing structure and cost per transaction. For AWS, you do need to be aware of the expenses of building and managing those things yourself that AWS handles for you; i.e. built into their cost. We can see, however, that in these examples, MyRocks is definitely a cost-effective solution when comparing direct costs.


When using bigger
gp2storage on RDS (to compensate for io) would this push a bigger cost on backup storage? I think the exact question would be more if I have a 5Tb disk but I only 100G would my backup be 100G or 5Tb? Thanks!They charge for 5Tb full backup but is a lot cheaper than the GP2 volume cost, and also for each day, they charge only for the changed data, so effectively they are 1 full backup and then N incremental ones.