
Percona Monitoring and Management (PMM) is a free and open-source platform for managing and monitoring MySQL® and MongoDB® performance. You can run PMM in your own environment for maximum security and reliability. It provides thorough time-based analysis for MySQL® and MongoDB® servers to ensure that your data works as efficiently as possible.

This release offers two new features for both the MySQL Community and Percona Customers:
SELECT into a dashboard!We addressed 17 new features and improvements, and fixed 17 bugs.
In 1.15 we are introducing the ability to take a SQL SELECT statement and turn the result set into metric series in PMM. The queries are executed at the LOW RESOLUTION level, which by default is every 60 seconds. A key advantage is that you can extend PMM to profile metrics unique to your environment (see users table example), or to introduce support for a table that isn’t part of PMM yet. This feature is on by default and only requires that you edit the configuration file and use vaild YAML syntax. The configuration file is in /usr/local/percona/pmm-client/queries-mysqld.yml.
We’re going to take a fictional MySQL users table that also tracks the number of upvotes and downvotes, and we’ll convert this into two metric series, with a set of seven labels, where each label can also store a value.
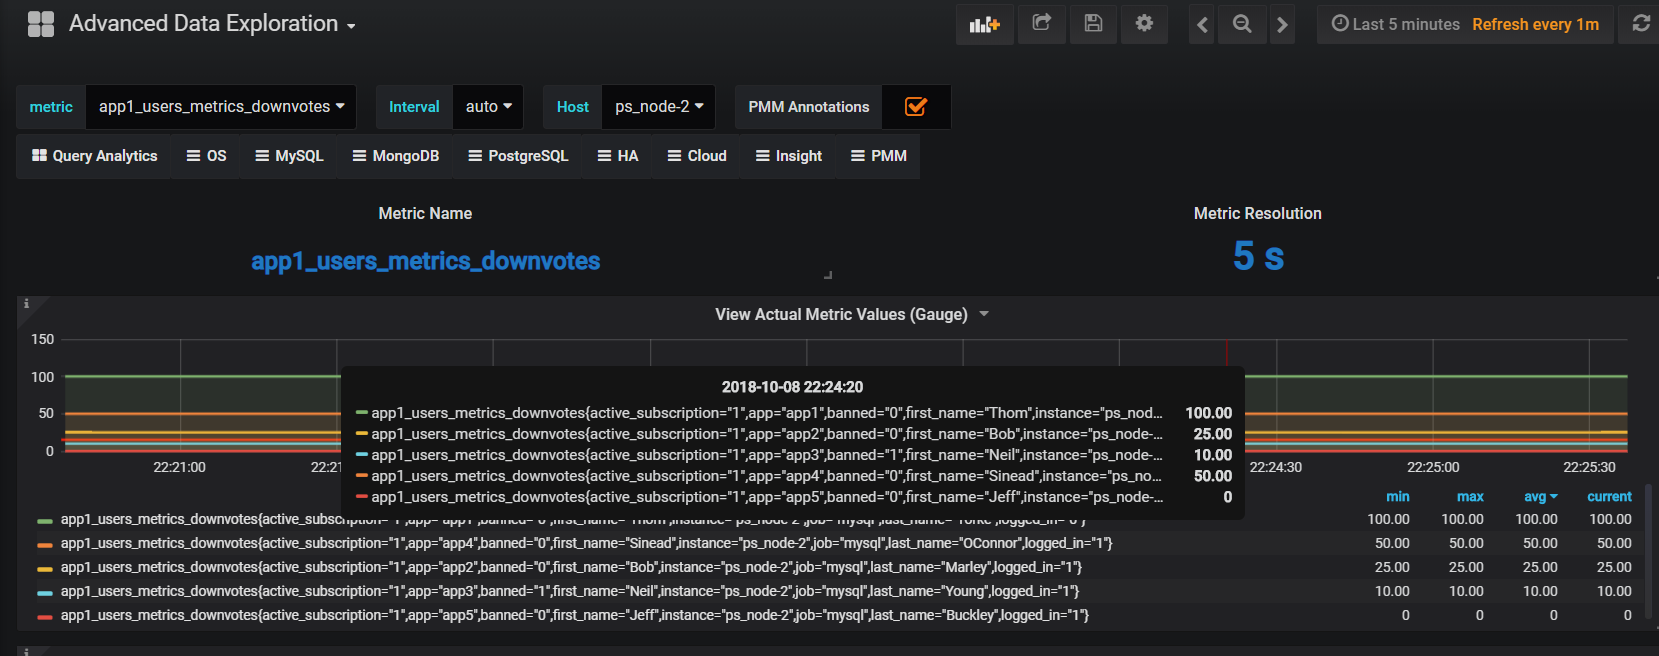
Lets look at the output so we understand the goal – take data from a MySQL table and store in PMM, then display as a metric series. Using the Advanced Data Exploration Dashboard you can review your metric series. Exploring the metric series app1_users_metrics_downvotes we see the following:
Lets assume you have the following users table that includes true/false, string, and integer types.
|
1 2 3 4 5 6 7 8 9 10 |
SELECT * FROM `users` +----+------+--------------+-----------+------------+-----------+---------------------+--------+---------+-----------+ | id | app | user_type | last_name | first_name | logged_in | active_subscription | banned | upvotes | downvotes | +----+------+--------------+-----------+------------+-----------+---------------------+--------+---------+-----------+ | 1 | app2 | unprivileged | Marley | Bob | 1 | 1 | 0 | 100 | 25 | | 2 | app3 | moderator | Young | Neil | 1 | 1 | 1 | 150 | 10 | | 3 | app4 | unprivileged | OConnor | Sinead | 1 | 1 | 0 | 25 | 50 | | 4 | app1 | unprivileged | Yorke | Thom | 0 | 1 | 0 | 100 | 100 | | 5 | app5 | admin | Buckley | Jeff | 1 | 1 | 0 | 175 | 0 | +----+------+--------------+-----------+------------+-----------+---------------------+--------+---------+-----------+ |
We’ll go through a simple example and mention what’s required for each line. The metric series is constructed based on the first line and appends the column name to form metric series. Therefore the number of metric series per table will be the count of columns that are of type GAUGE or COUNTER. This metric series will be called app1_users_metrics_downvotes:
|
1 2 3 4 5 6 |
app1_users_metrics: ## leading section of your metric series. query: "SELECT * FROM app1.users" ## Your query. Don't forget the schema name. metrics: ## Required line to start the list of metric items - downvotes: ## Name of the column returned by the query. Will be appended to the metric series. usage: "COUNTER" ## Column value type. COUNTER will make this a metric series. description: "Number of upvotes" ## Helpful description of the column. |
Each column in the SELECT is named in this example, but that isn’t required, you can use a SELECT * as well. Notice the format of schema.table for the query is included.
|
1 2 3 4 5 6 7 8 9 10 11 12 13 14 15 16 17 18 19 20 21 22 23 24 25 26 27 28 29 30 31 32 |
--- app1_users_metrics: query: "SELECT app,first_name,last_name,logged_in,active_subscription,banned,upvotes,downvotes FROM app1.users" metrics: - app: usage: "LABEL" description: "Name of the Application" - user_type: usage: "LABEL" description: "User's privilege level within the Application" - first_name: usage: "LABEL" description: "User's First Name" - last_name: usage: "LABEL" description: "User's Last Name" - logged_in: usage: "LABEL" description: "User's logged in or out status" - active_subscription: usage: "LABEL" description: "Whether User has an active subscription or not" - banned: usage: "LABEL" description: "Whether user is banned or not" - upvotes: usage: "COUNTER" description: "Count of upvotes the User has earned. Upvotes once granted cannot be revoked, so the number can only increase." - downvotes: usage: "GAUGE" description: "Count of downvotes the User has earned. Downvotes can be revoked so the number can increase as well as decrease." ... |
We hope you enjoy this feature, and we welcome your feedback via the Percona forums!
We’ve enhanced the volume of data collected from both the Server and Client perspectives. Each service provides a set of files designed to be shared with Percona Support while you work on an issue.
From the Server, we’ve improved the logs.zip service to include:
You retrieve the link from your PMM server using this format: https://pmmdemo.percona.com/managed/logs.zip
On the Client side we’ve added a new action called summary which fetches logs, network, and Percona Toolkit output in order to share with Percona Support. To initiate a Client side collection, execute:
|
1 |
pmm-admin summary |
The output will be a file you can use to attach to your Support ticket. The single file will look something like this:
|
1 |
summary__2018_10_10_16_20_00.tar.gz |
PMM is available for installation using three methods:
docker pull percona/pmm-server – DocumentationHelp us improve our software quality by reporting any Percona Monitoring and Management bugs you encounter using our bug tracking system.
Resources
RELATED POSTS


Interesting release! One question though:
“The queries are executed at the LOW RESOLUTION level, which by default is every 60 seconds”
How is it possible to change this default? What are the minimum and maximum (if any)?
ow to delete host in grafana? i have a mysql sever deprecate ,no need to monitor it ,how can i delete the host in grafana’s hot Drop-down menu?
TopStore- https://topstorevip.com/
Percona Monitoring and Management (PMM) 1.15.0 Is Now Available. This is one of the most awaited thing 🙂 Now, Can I import it to my tutuapp apps store protfolio here: https://tutuapplite.vip/
Thank You.
To install the latest version of the application. Download Play Store to install free game apps: https://chrome.google.com/webstore/detail/play-store/elecgpliaonaeonmaadgghkiemofoghl
You can run PMM in your own environment for maximum security and reliability. https://tutuapp-app.org/
Sadly all these tweaked applications comes from 3rd party developers and we cannot find them on official app stores. So we often resort to various methods to get these hacked applications. It would be so nice if we could get all these applications from just one app. Today we are going to tell you about an app named ‘AppEven’ which lets you download hacked and tweaked applications for free. https://appeven-download.com/