
 PMM (Percona Monitoring and Management) is a free and open-source platform for managing and monitoring MySQL and MongoDB performance. You can run PMM in your own environment for maximum security and reliability. It provides thorough time-based analysis for MySQL and MongoDB servers to ensure that your data works as efficiently as possible.
In release 1.12, we invested our efforts in the following areas:
We addressed 10 new features and improvements, and fixed 13 bugs.
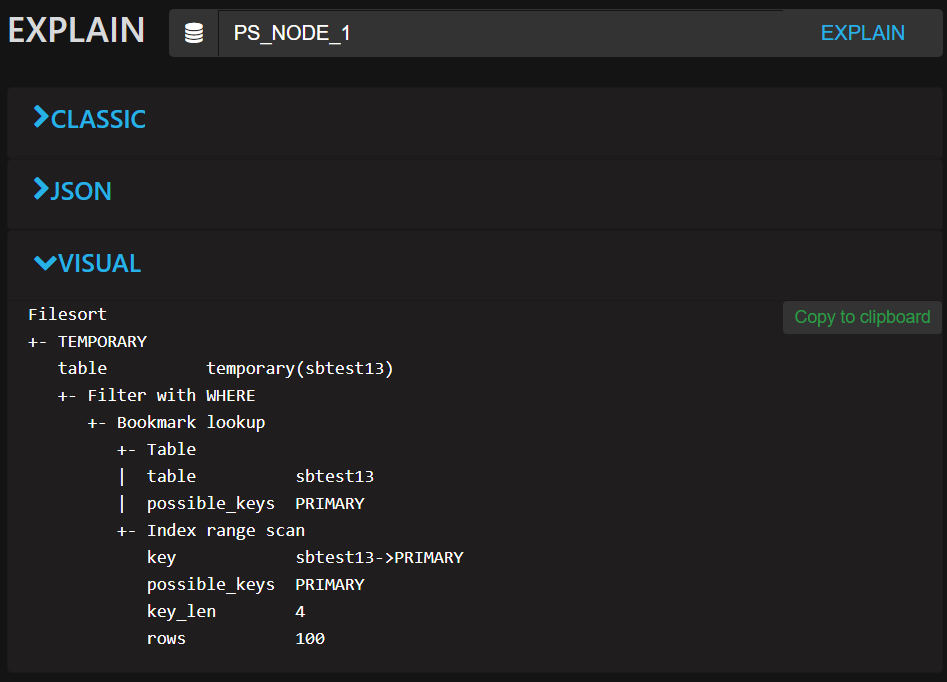
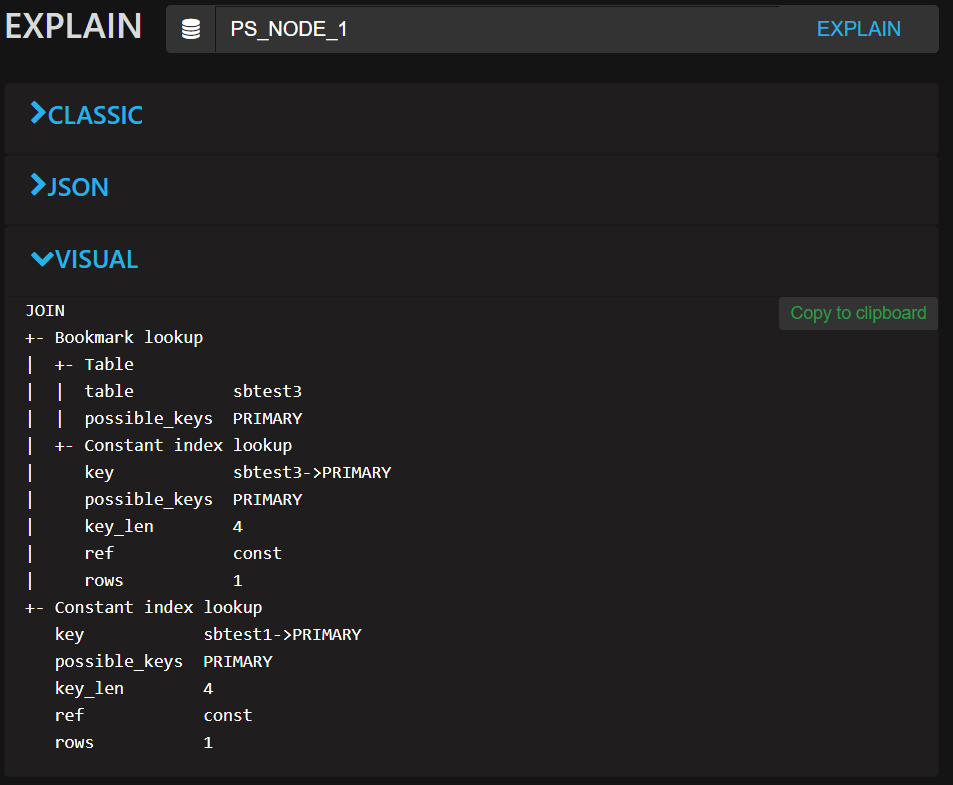
We’re working on substantial changes to Query Analytics and the first part to roll out is something that users of Percona Toolkit may recognize – we’ve introduced a new element called Visual Explain based on pt-visual-explain. This functionality transforms MySQL EXPLAIN output into a left-deep tree representation of a query plan, in order to mimic how the plan is represented inside MySQL. This is of primary benefit when investigating tables that are joined in some logical way so that you can understand in what order the loops are executed by the MySQL query optimizer. In this example we are demonstrating the output of a single table lookup vs two table join:
| Single Table Lookup | Two Tables via INNER JOIN |
|---|---|
SELECT DISTINCT c |
SELECT sbtest3.c |
 |
 |
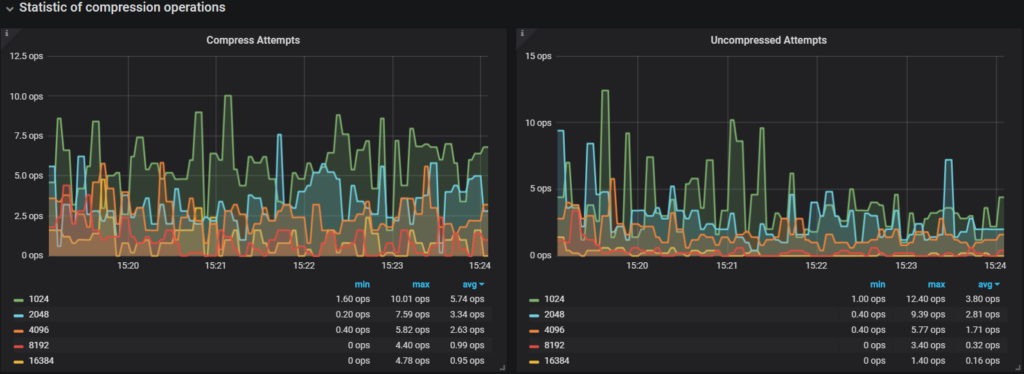
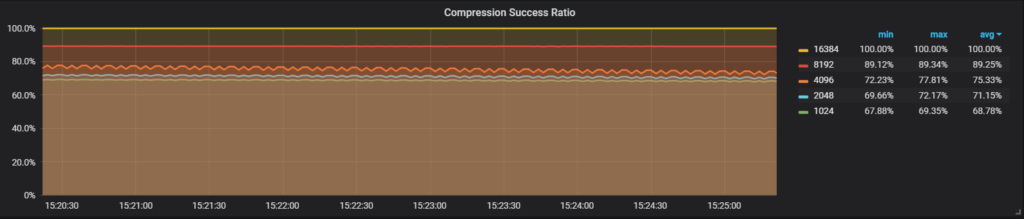
A great feature of MySQL’s InnoDB storage engine includes compression of data that is transparently handled by the database, saving you space on disk, while reducing the amount of I/O to disk as fewer disk blocks are required to store the same amount of data, thus allowing you to reduce your storage costs. We’ve deployed a new dashboard that helps you understand the most important characteristics of InnoDB’s Compression. Here’s a sample of visualizing Compression and Decompression attempts, alongside the overall Compression Success Ratio graph:
We have introduced a new dashboard that lets you do side-by-side comparison of Command (Com_*) and Handler statistics. A common use case would be to compare servers that share a similar workload, for example across MySQL instances in a pool of replicated slaves. In this example I am comparing two servers under identical sysbench load, but exhibiting slightly different performance characteristics:
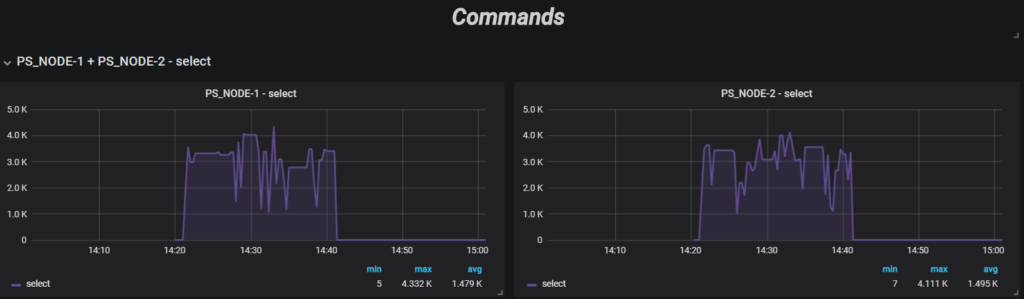
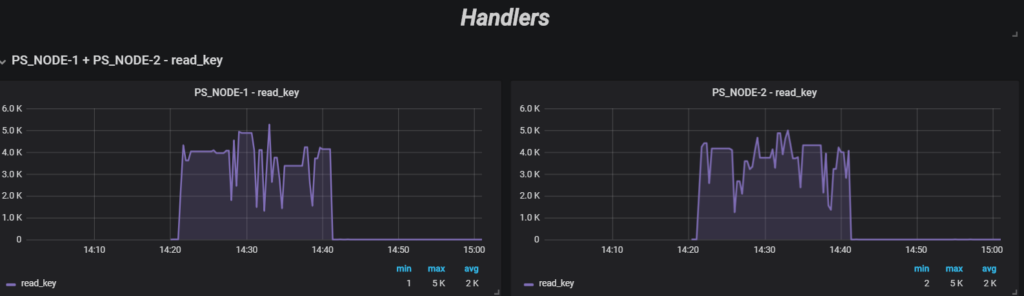
The number of servers you can select for comparison is unbounded, but depending on the screen resolution you might want to limit to 3 at a time for a 1080 screen size.
PMM is available for installation using three methods:
docker pull percona/pmm-server – Documentation
Resources
RELATED POSTS