
Introduction
When people think about Percona’s microslow patch immediately a question arises how much logging impacts on performance. When we do performance audit often we log every query to find not only slow queries. A query may take less than a second to execute, but a huge number of such queries may significantly load a server. On one hand logging causes sequential writes which can’t impair performance much, on other hand when every query is logged there is a plenty of write operations and obviously performance suffers. Let’s investigate how much.
I took DBT2, an OSDL’s implementation of TPC-C.
Hardware used
The benchmark was run on a DELL server running CentOS release 4.7 (Final)
There are four CPUs Intel(R) Xeon(R) CPU 5150 @ 2.66GHz, 32GB RAM. There are 8 disks in RAID10(a mirror of 4+4 striped disks).
Software
It was used MySQL 5.0.75-percona-b11 on CentOS release 4.7
MySQL setting
There were two cases considered CPU- and IO-bound.
Each case had three options:
MySQL was run with default settings except following:
|
1 2 3 4 5 6 7 |
[mysqld] user=root max_connections=3000 innodb_log_file_size=128M innodb_flush_log_at_trx_commit=1 innodb_file_per_table table_cache=2000 |
Depending on workload different InnoDB buffer was used.
In CPU-bound case
|
1 |
innodb_buffer_pool_size=2G |
In IO-bound case
|
1 2 |
innodb_buffer_pool_size=512M innodb_flush_method=O_DIRECT |
DBT2 settings
For CPU-bound case number of warehouses was 10(1.31GiB). In case of IO-bound load — 100 warehouses which is 10GiB in terms of database size.
The test was run with 1, 20 and 100 database connections
Results
To reduce random error the test was run 3 times per each parameter set.
The metric of a DBT2 test is NOTPM (New Order Transaction per Minute) — the more the better.
CPU-bound case – 10 warehouses
| # of connections | No logging, NOTPM | Logging queries >1 SEC, NOTPM | ratio 1 sec / no_logging | Logging all queries, NOTPM | Ratio all_logging / no_logging |
| 1 | 9607 | 9632 | 1.00 | 8434 | 0.88 |
| 20 | 27612 | 27720 | 1.00 | 22105 | 0.80 |
| 100 | 11704 | 11741 | 1.00 | 10956 | 0.94 |
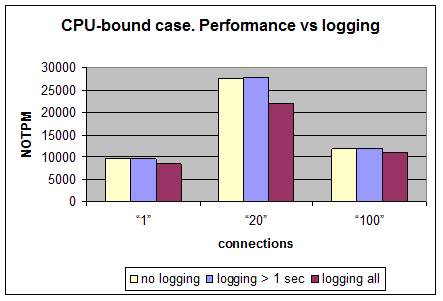
We see here that logging all queries decreases MySQL’s performance on 6-20% depending on a number of connections to a database.
It should be noted during the test it was executed roughly 20-25k queries per second. If all queries are logged — a slow log is populated at rate about 10MB/sec. This is the highest rate observed.
IO-bound case — 100 warehouses
| # of connections | No logging, NOTPM | Logging queries > 1 sec, NOTPM | Ratio no_logging / 1 sec_logging | Logging all, NOTPM | Ratio no_logging / all_logging |
| 1 | 225 ± 9 | 211 ± 3 | 0.94 | 213 ± 9 | 0.95 |
| 20 | 767 ± 41 | 730 ± 35 | 0.95 | 751 ± 33 | 0.98 |
| 100 | 746 ± 54 | 731 ± 12 | 0.98 | 703 ± 36 | 0.94 |
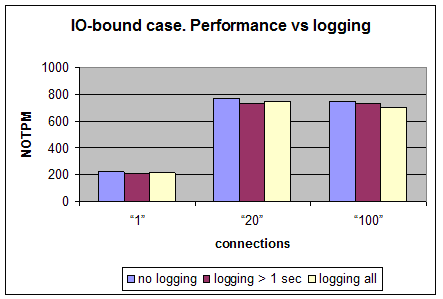
In this case every test was run 5 times and random measurement error was calculated. As it is seen from the chart above the performance almost doesn’t depend on logging — the difference doesn’t exceed the measurement error.
The query rate in this case is about 1000 per second.
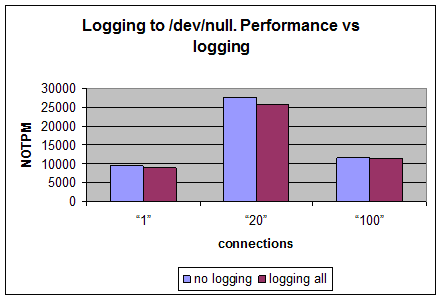
Logging to /dev/null
It is interesting to know how much from performance degradation caused by the microslow patch itself. Let’s do the same tests but logging to /dev/null.
| # of connections | No logging, NOTPM | Logging all queries, NOTPM | Ratio all_logging /no_logging |
| 1 | 9512 | 8943 | 0.94 |
| 20 | 27675 | 25869 | 0.93 |
| 100 | 11609 | 11236 | 0.97 |
Conclusion
From the all tests above there are two conclusions can be made:
Resources
RELATED POSTS


