
Percona Monitoring and Management (PMM) is a free and open-source platform for managing and monitoring MySQL® and MongoDB® performance. You can run PMM in your own environment for maximum security and reliability. It provides thorough time-based analysis for MySQL® and MongoDB® servers to ensure that your data works as efficiently as possible.
 There are a number of significant updates in Percona Monitoring and Management 1.9.0 that we hope you will like, some of the key highlights include:
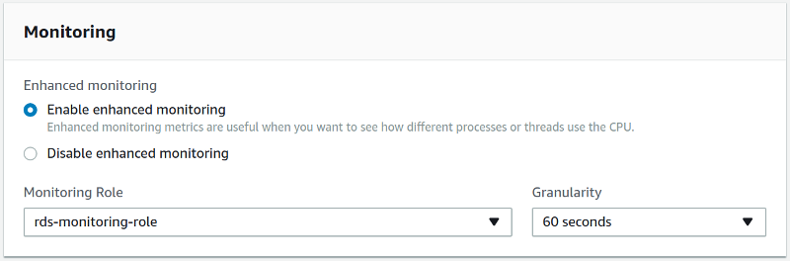
Since we are already consuming Amazon Cloudwatch metrics and persisting them in Prometheus, we have improved six node-specific dashboards to now display Amazon RDS node-level metrics:
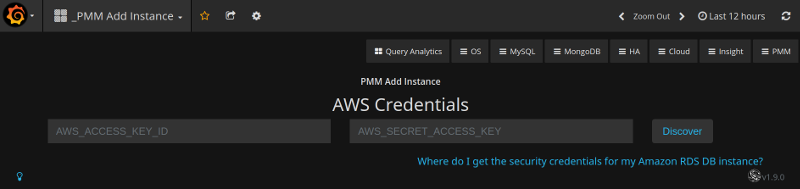
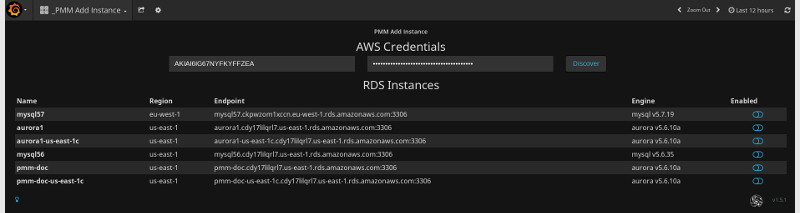
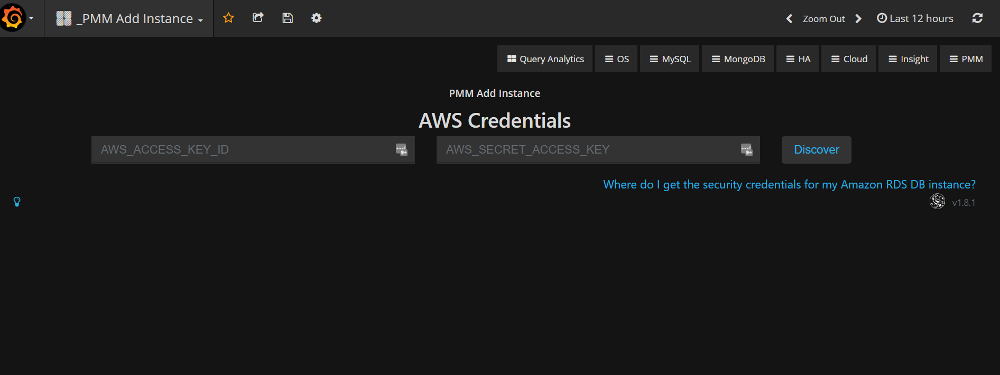
We have changed our AWS add instance interface and workflow to be more clear on information needed to add an Amazon Aurora MySQL or Amazon RDS MySQL instance. We have provided some clarity on how to locate your AWS credentials.
We have improved our documentation to highlight connectivity best practices, and authentication options – IAM Role or IAM User Access Key.
Enabling Enhanced Monitoring
Credentials Screen
You can now run Percona Monitoring and Management Server on instances with memory as low as 512MB RAM, which means you can deploy to the free tier of many cloud providers if you want to experiment with PMM. Our memory calculation is now:
|
1 2 3 4 |
METRICS_MEMORY_MULTIPLIED=$(( (${MEMORY_AVAIABLE} - 256*1024*1024) / 100 * 40 )) if [[ $METRICS_MEMORY_MULTIPLIED < $((128*1024*1024)) ]]; then METRICS_MEMORY_MULTIPLIED=$((128*1024*1024)) fi |
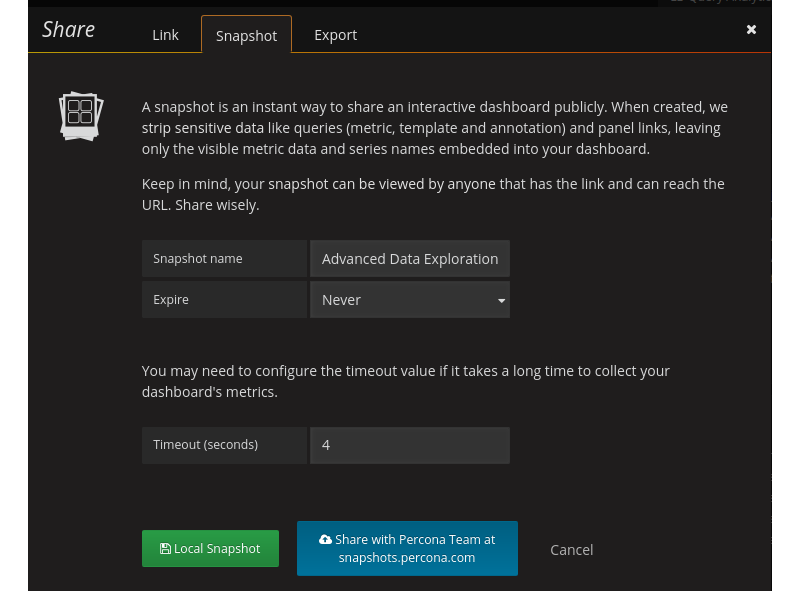
Snapshots are a way of sharing PMM dashboards via a link to individuals who do not normally have access to your PMM Server. If you are a Percona customer you can now securely share your dashboards with Percona Engineers. We have replaced the button for sharing to the Grafana publicly hosted platform onto one administered by Percona. Your dashboard will be written to Percona snapshots and only Percona Engineers will be able to retrieve the data. We will be expiring old snapshots automatically at 90 days, but when sharing you will have the option to configure a shorter retention period.
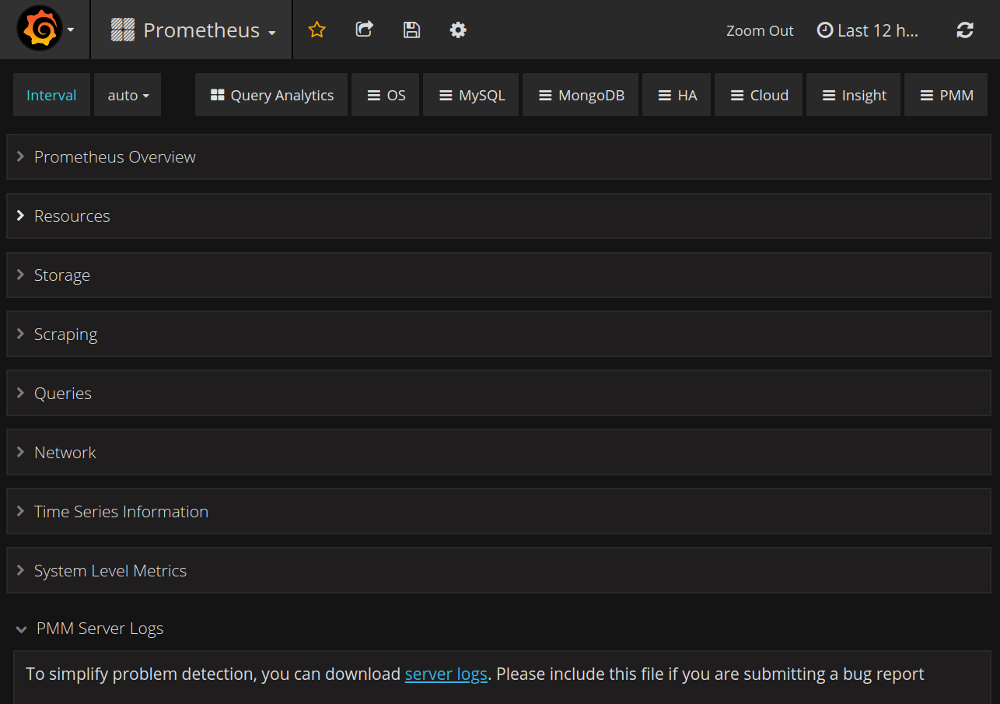
In this release, the logs from PMM Server can be exported using single button-click, avoiding the need to log in manually to the docker container. This simplifies the troubleshooting process of a PMM Server, and especially for Percona customers, this feature will provide a more consistent data gathering task that you will perform on behalf of requests from Percona Engineers.
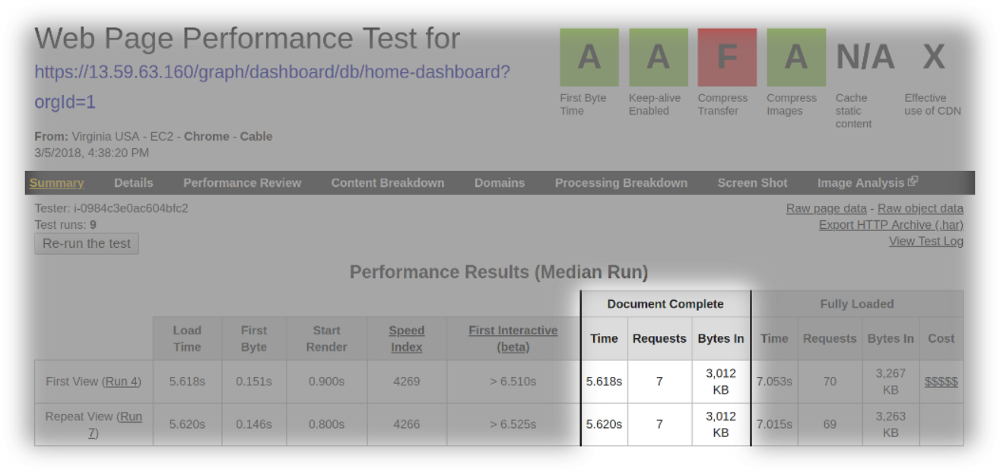
In Percona Monitoring and Management version 1.8.0, the index page was redesigned to reveal more useful information about the performance of your hosts as well an immediate access to essential components of PMM, however the index page had to load much data dynamically resulting in a noticeably longer load time. In this release we enabled gzip and HTTP2 to improve the load time of the index page. The following screenshots demonstrate the results of our tests on webpagetest.org where we reduce page load time by half. We will continue to look for opportunities to improve the performance of the index page and expect that when we upgrade to Prometheus 2 we will see another improvement.
The load time of the index page of PMM version 1.8.0
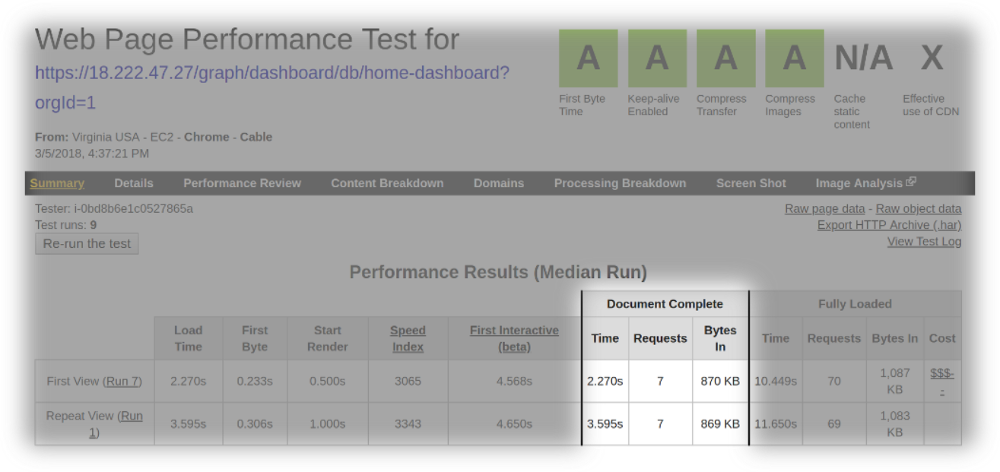
The load time of the index page of PMM version 1.9.0
mongodb_up variable for the MongoDB Overview dashboard to identify if a host is MongoDB.mysql:metrics service will not start on Ubuntu LTS 16.04Help us improve our software quality by reporting any bugs you encounter using our bug tracking system.
Resources
RELATED POSTS


Great level of knowledge skills, man. I am impressed. I want to add my sql servers on top speed of my app called http://topstorevipapp.com/ . Can anyone assist me in this please ??? . TIA.
I think a better solution would be to install Ignition App via https://kubadownload.com/news/ignition-app
If you are a Android user and you want to get all kinds of modified,tweaked applications,then you need a single app which enables you to get all paid apps free. https://appevendownloads.com/