
Percona Monitoring and Management (PMM) is an open source database observability, monitoring, and management tool for use with MySQL, PostgreSQL, MongoDB, and the servers on which they run.


PMM
Unified dashboards, query analytics and configuration insight across on-premises, cloud and hybrid environments. Enabling teams to monitor, manage and optimize databases anywhere.
Benefits
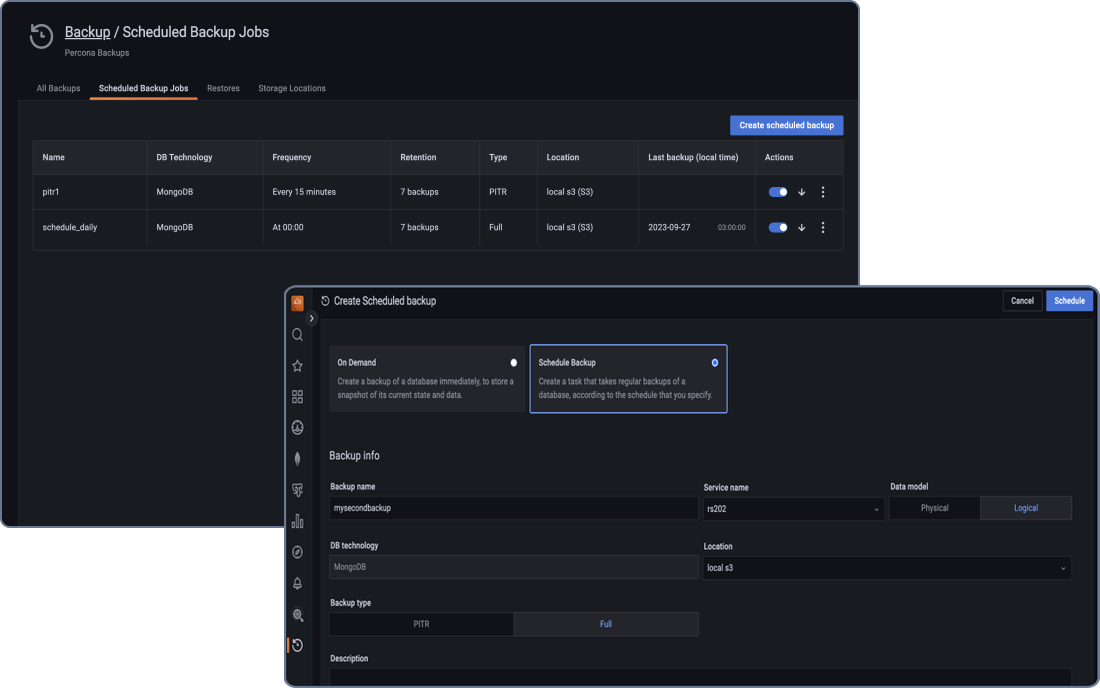
Percona Monitoring and Management (PMM) includes built-in backup and restore capabilities for MongoDB and MySQL, so you can protect production data from the same interface you use to monitor it. Schedule hot, incremental, physical, or logical backups on demand or on a recurring cadence, and recover to an exact moment with point-in-time recovery (PITR). No separate tools, no cobbled-together scripts, no crossing your fingers at 2 a.m.
Benefits
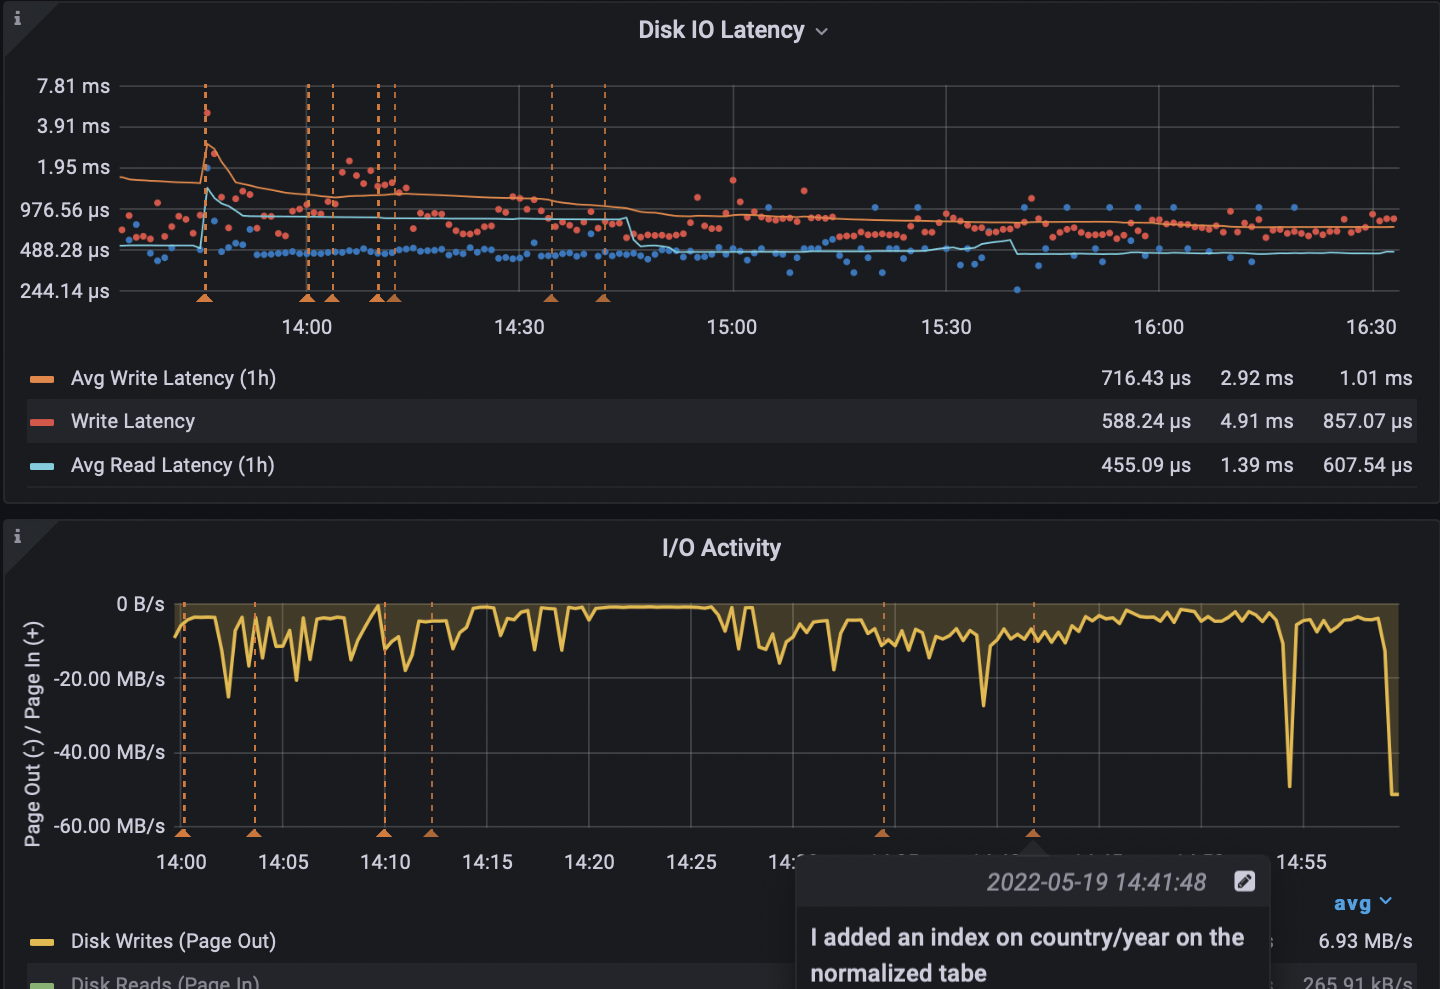
Percona Monitoring and Management (PMM) gives you a single pane of glass across your MySQL, MongoDB, and PostgreSQL databases. Instead of stitching together separate monitoring stacks for each engine, PMM delivers database-specific dashboards, query analytics, proactive alerting, and automated security checks from one open source platform. You see exactly what's happening inside every instance, from InnoDB metrics to WiredTiger details to PostgreSQL tuple activity, and you get notified the moment something goes wrong.
Benefits
Query Analytics in Percona Monitoring and Management (PMM) ranks every query by load so you can pinpoint the ones dragging down your database. It works across MySQL, MongoDB, and PostgreSQL from the same dashboard, letting you drill from fleet-level performance all the way down to a single problematic query. Spot anomalies, view explain plans, slice by any parameter you choose, and fix the bottleneck instead of guessing at it.
pg_stat_monitor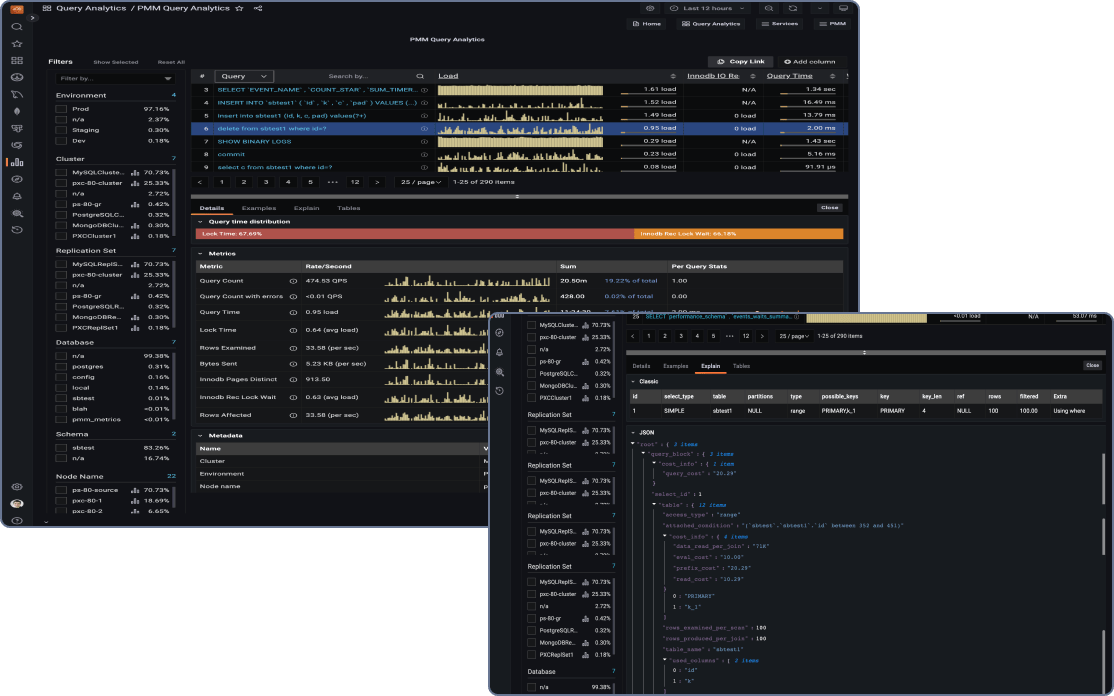
Benefits
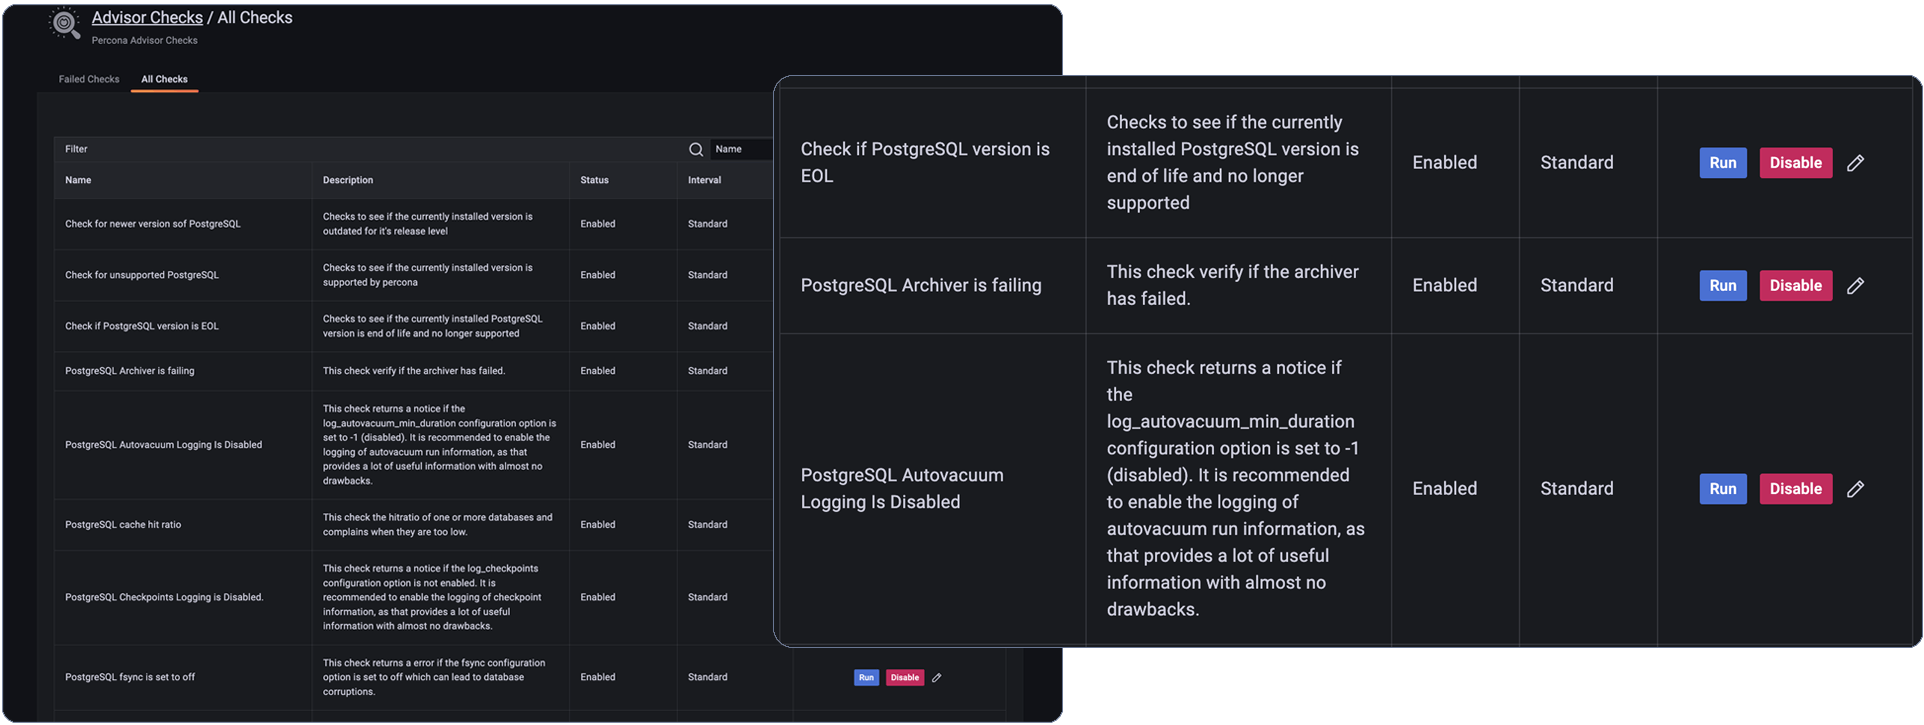
Percona Advisors, built into Percona Monitoring and Management (PMM), continuously scan your MySQL, MongoDB, and PostgreSQL databases for security gaps, misconfigurations, and performance problems. Think of them as automated checks distilled from decades of Percona database expertise. They run in the background, flag what needs attention, and tell you how to fix it, so small issues don't turn into outages.

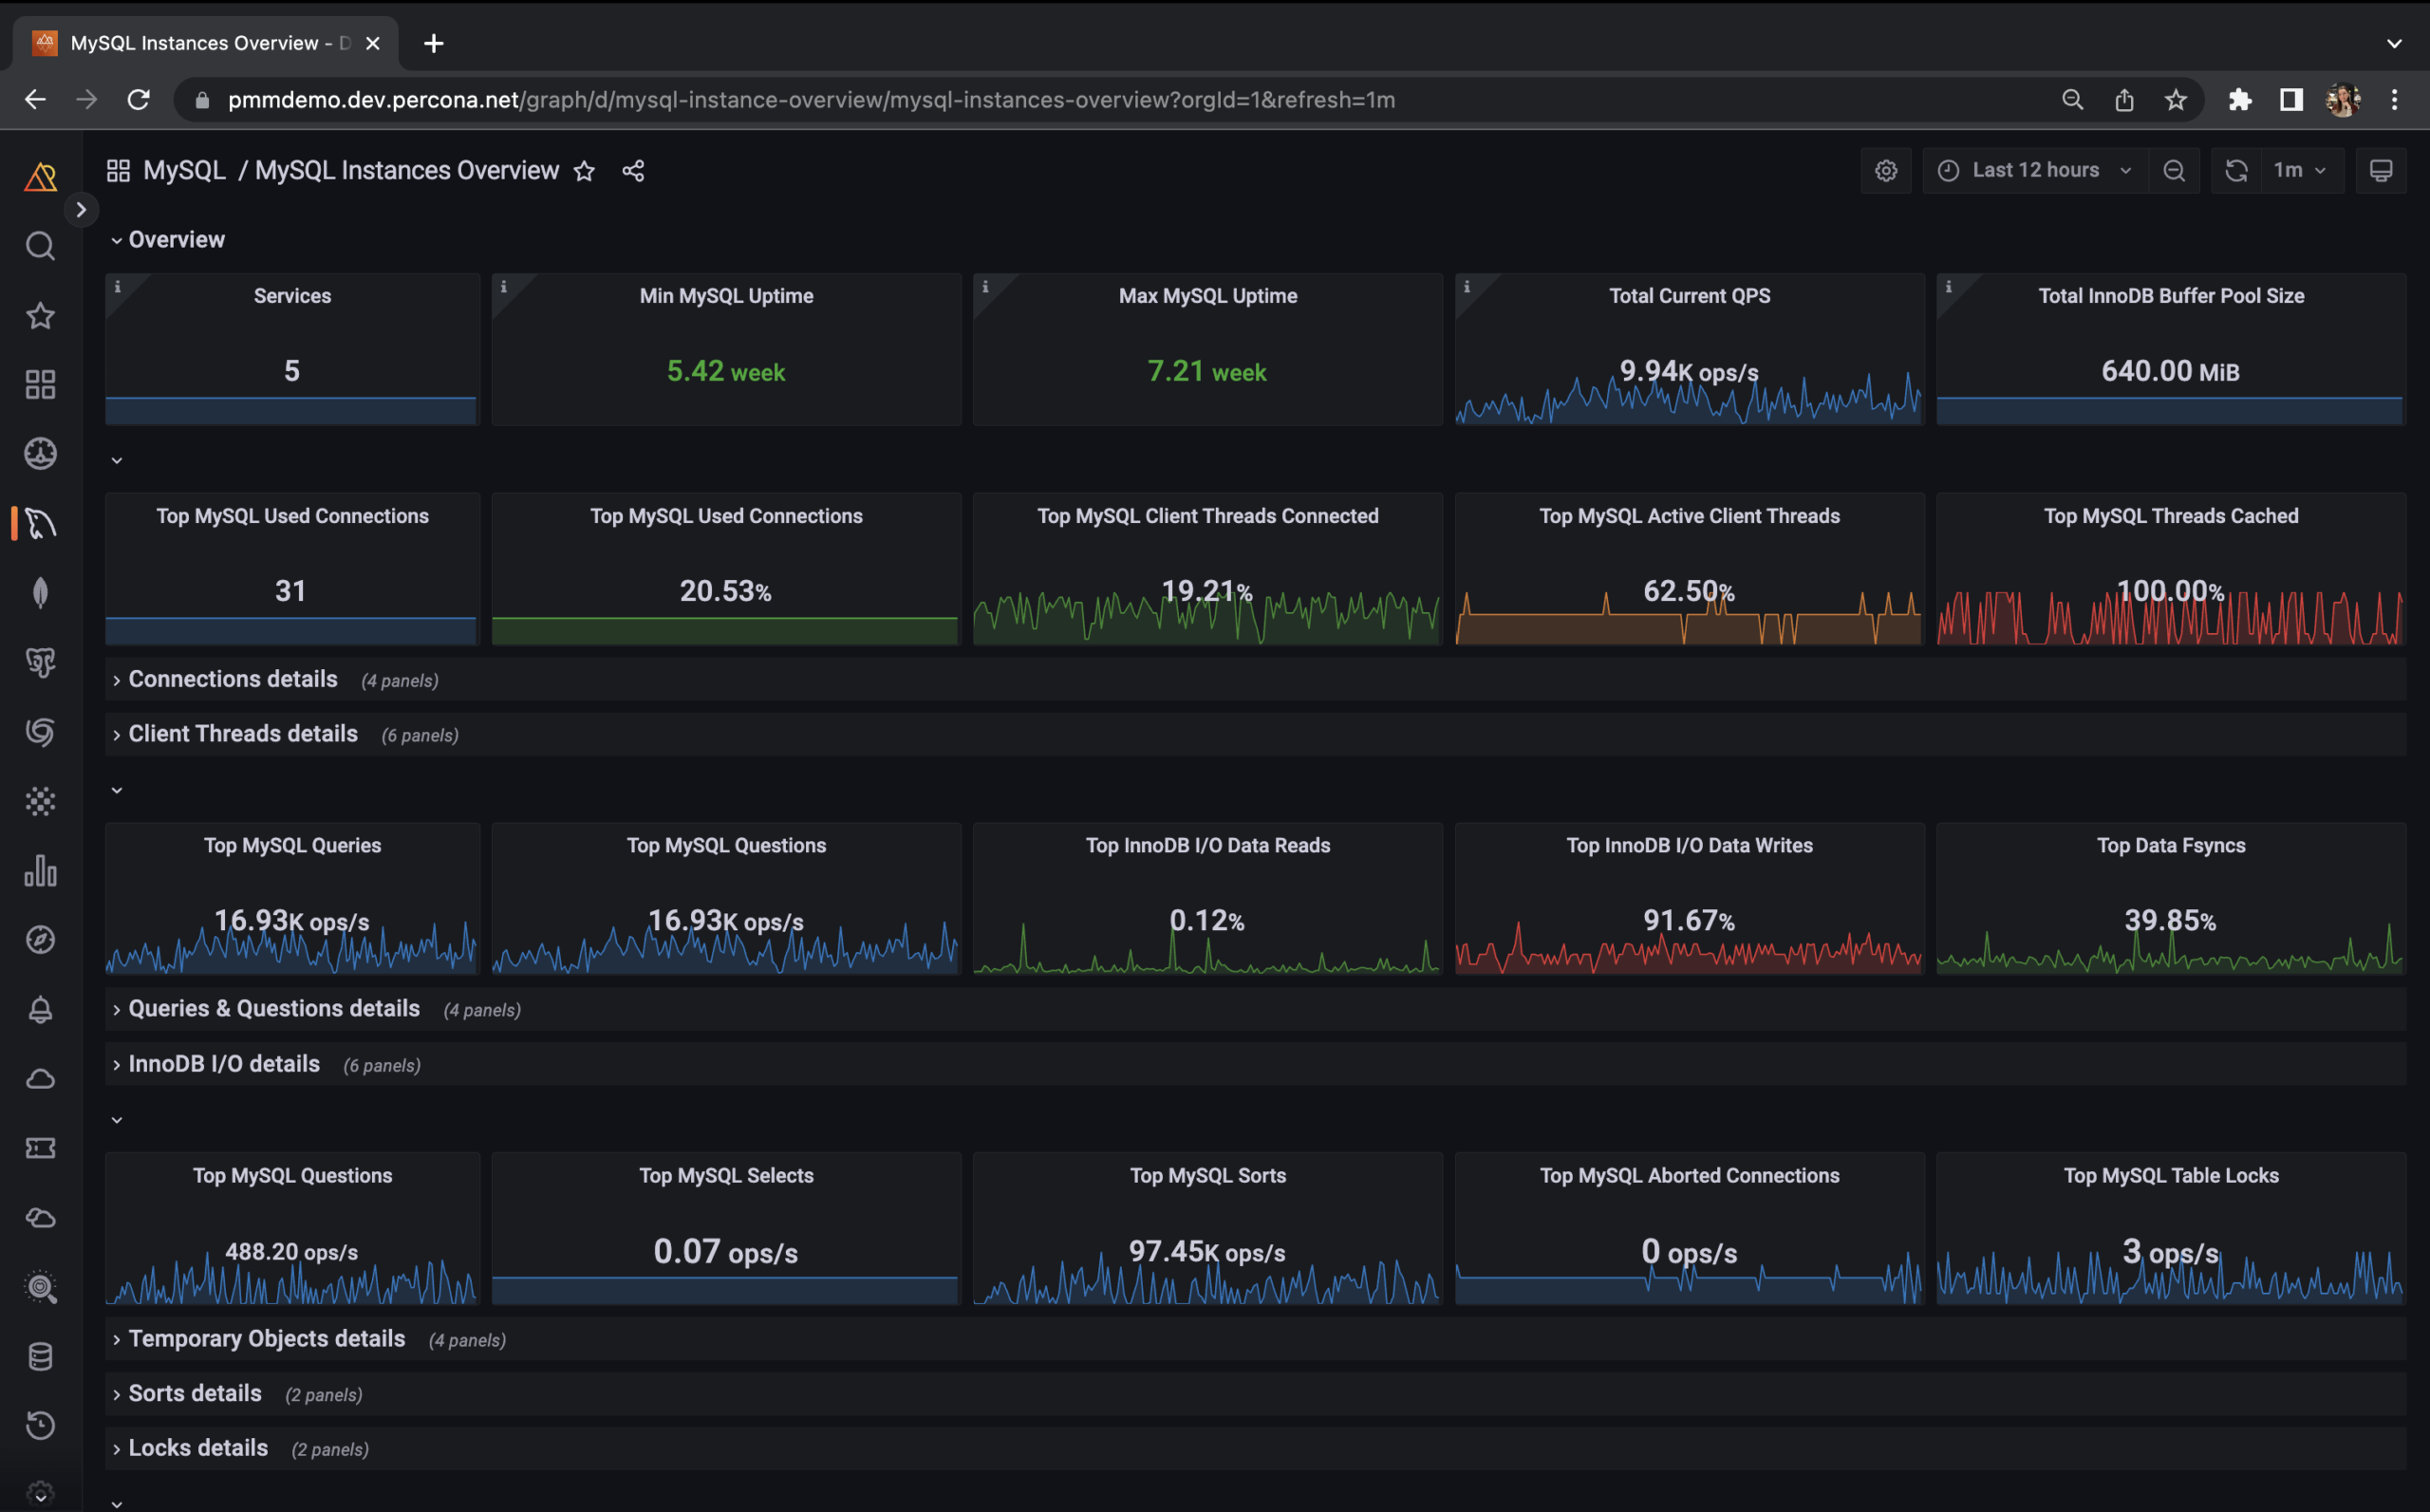
Percona Monitoring and Management provides actionable performance data for MySQL variants, including Percona Server for MySQL, Percona XtraDB Cluster, Oracle MySQL Community Edition, Oracle MySQL Enterprise Edition, and MariaDB. PMM captures metrics and data for the InnoDB, XtraDB, and MyRocks storage engines, and has specialized dashboards for specific engine details.
Percona Monitoring and Management monitors and provides actionable performance data for PostgreSQL. It captures metrics and data for PostgreSQL such as Connections, Active Connections, Tuples, Tuple Activity, and more. PMM provides:
Percona Monitoring and Management provides actionable performance data for MongoDB variants, including Percona Server for MongoDB, MongoDB Community Server, and MongoDB Enterprise Server. PMM includes these specialized MongoDB dashboards for graphing WiredTiger, MMAPv1, InMemory, and RocksDB storage engines:
Percona Monitoring and Management is designed to work with Amazon RDS MySQL and Amazon Aurora MySQL. PMM has a specific dashboard for monitoring Amazon Aurora MySQL using Cloudwatch and direct sampling of MySQL metrics:
Percona Monitoring and Management is designed to work with ProxySQL. ProxySQL is a high-performance SQL proxy. ProxySQL runs as a daemon watched by a monitoring process. The process monitors the daemon and restarts it in case of a crash, to minimize downtime.
With PMM, you can use this dashboard overview to gather metrics for ProxySQL and its interactions with the database and applications.
Percona XtraDB Cluster is an active/active high availability and high scalability open source solution for MySQL clustering. It integrates Percona Server for MySQL and Percona XtraBackup with the Codership Galera library of MySQL high availability solutions in a single package that enables you to create a cost-effective MySQL high availability cluster. Dashboard information includes:
Resources