This blog is based on a real production case in which users experienced a serious delay in logical replication. Let me try to explain how to approach similar cases and analyze them in an easy method, because lag in logical replication is a common problem, and we should expect it to come up for different environments. But sometimes troubleshooting can be challenging, especially on DBaaS environments where we won’t get in-depth information at OS / hardware level. Such situations force us to deal with limited information which is available within the PostgreSQL connection (No host-level troubleshooting possible)
The case that triggered this blog was an attempt to migrate from one cloud vendor, to a recent version of PostgreSQL on a DBaaS offering of another cloud vendor. They started observing huge replication lag and reported to Percona. As usual, we started with pg_gather data collection.
(At Percona, we use pg_gather for diagnosis. Even though this blog and diagnosis refers to pg_gather report, any good diagnosis tool / scripts which can help to study the wait-event pattern and lag details could be able to help)
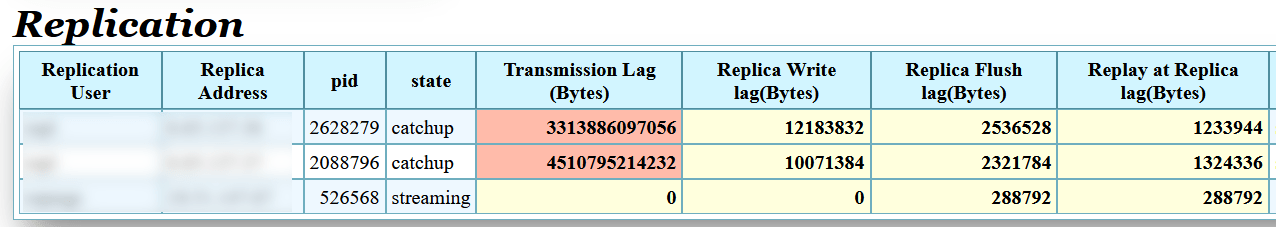
We saw upto 4.5 terabyte lag is happening at the transmission side (Publisher) on the customer case. The “Transmission” lag” is the difference between the latest generated LSN and the LSN which the WAL Sender is able to send (sent_lsn of pg_stat_replication). That’s a first indication that the problem is mainly at the publisher side (WAL Sender) and it is not able to send the information fast enough.
Next step of investigation is to understand what both those WAL Senders might be doing. The wait event information for each WAL Sender could provide a clear clue on where the delay is happening.
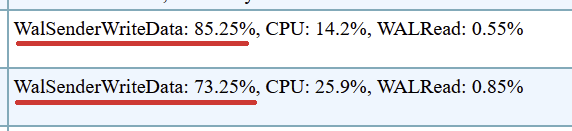
Both the WAL Senders are mainly waiting in “WalSenderWriteData” event upto 85% of its time. This is a very unusual level of wait.
Following is the logic behind this.
Source code reference : src/backend/replication/walsender.c
Which means that this wait event could happen due to the following reasons which I could think about. I would appreciate your comments if you know more reasons.
Now the question would be : Now we know all the probable causes, but how to narrow down to the most probable cause ?, so that we can have an action plan.
At Percona, our engineers take time to put all hypotheses for testing, trying to simulate similar conditions and produce observable and reproducible cases. One might argue that we can use low level tracing / OS level tools at this stage to narrow down. Definitely, Yes. That’s the most appropriate thing to do. However many of the users may not have low level access and DBaaS offerings prevent it by design. But the good news is that wait – event patterns can tell us a story in more detail.
If the network connectivity from Publisher side is slow or suffering with high latency, the send buffer won’t get cleared fast enough. Resulting in repeated attempts to send the data.
When we simulated the situation in the lab, we observed the similar Transmission side lag

Since this is a network connection problem, automatically the acknowledgment coming from the subscriber side will also be delayed and expected to show lags in all Write, Flush and Replay stages, which is visible in the data collection.
Obviously, our next question is what WALSender is doing ?. The wait events reveal that

The WAL sender is struggling to send data to Standby. This matches with what the user was seeing in their database.
Meanwhile, at the subscriber side, what we could see is that the apply worker is majorly sitting idle in the main loop: LogicalApplyMain

Two other major symptoms to be noted in the cases is 1). much smaller “Write lag” and compared to “Transmission lag” and 2.). Both the subscribers are suffering the lag, which is less probable if the problem is on the subscriber side. Even additional clues like data collection running longer when executed from the publisher side about the subscriber instance is also supplementary evidence.
All the above symptoms helps us to conclude with a reasonable level of confidence that the network traffic from the Publisher is the problem.
The problem could be caused by subscriber not communicating fast enough with Publisher. In such cases the replication lag is expected. I tested that scenario and the following is the observation.
The cause of the lag shifts from the “Transmission lag” to “Replica Write Lag”, which is the difference between send_lsn and write_lsn.
The WAL Sender / publisher side don’t have any problem in sending
That looks really cool. The major wait event is WalSenderWaitForWal. Which means that the WAL sender is just waiting for the next WAL to be flushed and ready, In other words, sleeping until the next commit.
However, the situation on the Subscriber side is different. Unlike in the previous case, the apply worker could be busy with all sorts of work, no more free time to wait in the main loop.

The wait events and their percentage may vary depending on the performance-bottleneck on the subscriber side.
The impact of the network traffic from the Subscriber side back to Publisher has less effect than that from Publisher side. Because the data flow is from Publisher to Subscriber. The Subscriber needs to send only handshake acknowledgment information back to the publisher, which requires less bandwidth. So an apply worker can be waiting in the main loop (LogicalApplyMain)

But contrary to expectations, there could be cases of significant CPU usage if there are repeated attempts to reach primary, it may be consuming significant CPU cycles. If we are suspecting network problems from the subscriber side, paying close attention to PostgreSQL logs is important.
There can be timeout captured in PostgreSQL logs at the publisher side
|
1 2 3 |
2026-04-23 17:34:07.078 UTC [36057] postgres@postgres LOG: terminating walsender process due to replication timeout 2026-04-23 17:34:07.078 UTC [36057] postgres@postgres CONTEXT: slot "sub", output plugin "pgoutput", in the commit callback, associated LSN DA/70450B8 2026-04-23 17:34:07.078 UTC [36057] postgres@postgres STATEMENT: START_REPLICATION SLOT "sub" LOGICAL D9/DF13B50 (proto_version '4', streaming 'parallel', origin 'any', publication_names '"pub"') |
Corresponding errors might be appearing at subscriber side also
|
1 2 3 |
2026-04-23 17:36:00.933 UTC [38413] ERROR: could not receive data from WAL stream: SSL connection has been closed unexpectedly 2026-04-23 17:36:00.940 UTC [38428] LOG: logical replication apply worker for subscription "sub" has started 2026-04-23 17:36:00.946 UTC [18241] LOG: background worker "logical replication apply worker" (PID 38413) exited with exit code 1 |
All these are indications of poor connection.
PostgreSQL Wait events provide lots of visibility into PostgreSQL and underlying infrastructure problems. Reading it with PostgreSQL statistics information (pg_stat_*) and PostgreSQL log could provide answers for a lot of questions as follows easily.
Collecting and correlating the wait-event data from both sides of the replication, checking the LSN differences, and information from PostgreSQL logs gives us a complete picture.
All it takes is just a couple of minutes! With the right tools and methods in hand. I would like to encourage readers to make use of wait event pattern analysis for easy spotting of performance bottlenecks, if you are not doing it already. It can save you from the treachery of all indepth tracing. Observed Replication lag can be treated as a symptom of something more serious underlying.
This blog is written for those who don’t have access to OS level, But if we have access, getting into details is far easier. For example, the send queue (Send-Q) of the Publisher host can be checked like:
|
1 2 3 |
postgres@node0:~$ ss -tnp State Recv-Q Send-Q Local Address:Port Peer Address:Port Process ESTAB 0 18791538 172.18.0.2:5432 172.18.0.3:44974 users:(("postgres",pid=48178,fd=11)) |
Resources
RELATED POSTS