
Unveiling the Limits: A Performance Analysis of MongoDB Sharded Clusters with plgm
In any database environment, assumptions are the enemy of stability. Understanding the point at which a system transitions from efficient to saturated is essential for maintaining uptime and ensuring a consistent and reliable user experience. Identifying these limits requires more than estimation—it demands rigorous, reproducible, and scalable load testing under realistic conditions.
To support this effort, we introduced you to plgm: Percona Load Generator for MongoDB Clusters.
PLGM is a high-performance benchmarking tool written in Go and designed to simulate realistic workloads against MongoDB clusters. Its ability to accept the same collection structures and query definitions used in the application you want to test, generate complex BSON data models, support high levels of concurrency, and provide detailed real-time telemetry makes it an ideal solution for this type of analysis
This article builds directly upon our initial blog introducing PLGM, Introducing Percona Load Generator for MongoDB Clusters: The Benchmark Tool That Simulates Your Actual Application.
As detailed in that post, PLGM was created to address the limitations of known synthetic benchmarking tools like YCSB, sysbench, pocdriver, mgodatagen and others. While those tools are excellent for measuring raw hardware throughput, they often fail to predict how a database will handle specific, complex and custom application logic. PLGM differentiates itself by focusing on realism: it uses “configuration as code” to mirror your actual document structures and query patterns, ensuring that the benchmark traffic is indistinguishable from real user activity. Please read our blog post above for more information and full comparison.
Using PLGM, we executed a structured series of workloads to identify optimal concurrency thresholds, maximum throughput capacity, and potential hardware saturation points within the cluster. The analysis includes multiple workload scenarios, including a read-only baseline and several variations of mixed and read-only workload simulations.
Ultimately, these tests reinforce an important reality: performance is not a fixed value. It is a moving target that depends entirely on workload characteristics, system architecture, and how the environment is configured and optimized.
The environment we used for this test consists of the following architecture (all nodes have the same hardware specifications):
Percona Load Generator for MongoDB Clusters comes pre-configured with a sample database, collection, and workload, allowing you to start benchmarking your environment immediately without needing to design a workload from scratch.
This is particularly useful for quickly understanding how PLGM operates and evaluating its behavior in your environment. Of course, you have full flexibility to customize the workload to suit your specific needs, as detailed in our documentation.
The default workload used in this blog post is to showcase how PLGM works, highlighting its functionality and benefits. The default workload has the following characteristics:
Note on collection size and document count:
The default workload performs only 5% of its operations as inserts. To generate a larger number of documents, simply adjust the query distribution ratio, batch size and concurrency. You have full control over the number of documents and the size of the database. For example, you can set PLGM_INSERT_PERCENT=100 to perform 100% inserts and PLGM_INSERT_BATCH_SIZE to increase the number of documents per batch, this would of course increase the document count and collection size accordingly.
Environment variables set for the test workload shown below
Once the above env vars have been set, all you need to do is run the application:
|
1 |
./plgm_linux config_plgm.yaml |
Sample Output:
Collection stats:
|
1 2 3 4 5 6 7 8 9 10 11 12 13 14 15 16 17 18 19 20 21 22 |
[direct: mongos] airline> printjson(statsPick("flights")); { sharded: true, size: 28088508, count: 14591, numOrphanDocs: 0, storageSize: 15900672, totalIndexSize: 4943872, totalSize: 20844544, indexSizes: { _id_: 659456, flight_id_hashed: 921600, 'flight_id_1_equipment.plane_type_1': 1163264, seats_available_1_flight_id_1: 712704, duration_minutes_1_seats_available_1_flight_id_1: 978944, 'equipment.plane_type_1': 507904 }, avgObjSize: 1925, ns: 'airline.flights', nindexes: 6, scaleFactor: 1 } |
Sample document structure:
|
1 2 3 4 5 6 7 8 9 10 11 12 13 14 15 16 17 18 19 20 21 22 23 24 25 26 27 28 29 30 31 32 33 34 35 36 37 38 39 40 41 |
[direct: mongos] airline> db.flights.findOne() { _id: ObjectId('695eca4be9d9322e2aae97eb'), duration_minutes: 841436202, flight_id: 1491473635, origin: 'Greensboro', gate: 'F20', seats_available: 2, passengers: [ { seat_number: '5E', passenger_id: 1, name: 'Janet Miller', ticket_number: 'TCK-15920051' }, { name: 'Keagan Reynolds', ticket_number: 'TCK-71064717', seat_number: '8A', passenger_id: 2 }, ... ommitted remaining passenger list for brevity .... ], agent_first_name: 'Earnest', agent_last_name: 'Thompson', flight_date: ISODate('2025-03-24T15:04:11.182Z'), destination: 'Chicago', flight_code: 'NM855', equipment: { plane_type: 'Boeing 777', total_seats: 43, amenities: [ 'Priority boarding', 'Extra legroom', 'Power outlets', 'WiFi', 'Hot meals' ] } } |
Now that you are familiar with how to use the application, we can proceed with the benchmarks. I have run six different workloads (detailed below) and provided an overall analysis demonstrating the benefits of using Percona Load Generator for MongoDB to test your cluster.
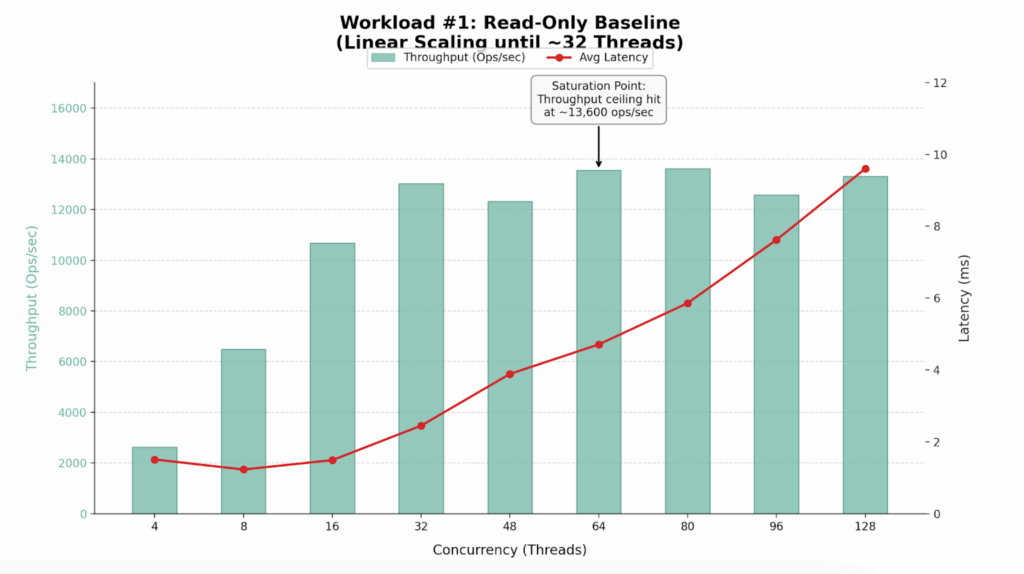
We began with a read-only workload to establish the theoretical maximum throughput of the cluster. We configured plgm to execute 100% find() operations targeting a specific shard key, ensuring efficient, index-optimized queries (this was defined in our custom queries.json file, you can see the readme for further details).
|
1 2 3 4 |
for x in 4 8 16 32 48 64 80 96 128; do PLGM_PASSWORD=**** PLGM_CONCURRENCY=${x} PLGM_QUERIES_PATH=queries.json PLGM_FIND_PERCENT=100 PLGM_REPLICASET_NAME="" PLGM_URI="mongodb://dan-ps-lab-mongos00.tp.int.percona.com:27017,dan-ps-lab-mongos01.tp.int.percona.com:27017" ./plgm_linux config_plgm.yaml ; sleep 15; done |
| Workers (Threads) | Throughput (Ops/Sec) | Avg Latency (ms) | Efficiency Verdict |
| 4 | 2,635 | 1.51 | Underutilized |
| 8 | 6,493 | 1.23 | Efficient Scaling |
| 16 | 10,678 | 1.49 | Efficient Scaling |
| 32 | 13,018 | 2.45 | Sweet Spot |
| 48 | 12,322 | 3.89 | Saturation Begins |
| 64 | 13,548 | 4.71 | Max Throughput |
| 80 | 13,610 | 5.86 | High Latency / No Gain |
| 96 | 12,573 | 7.62 | Degraded Performance |
| 128 | 13,309 | 9.60 | Oversaturated |
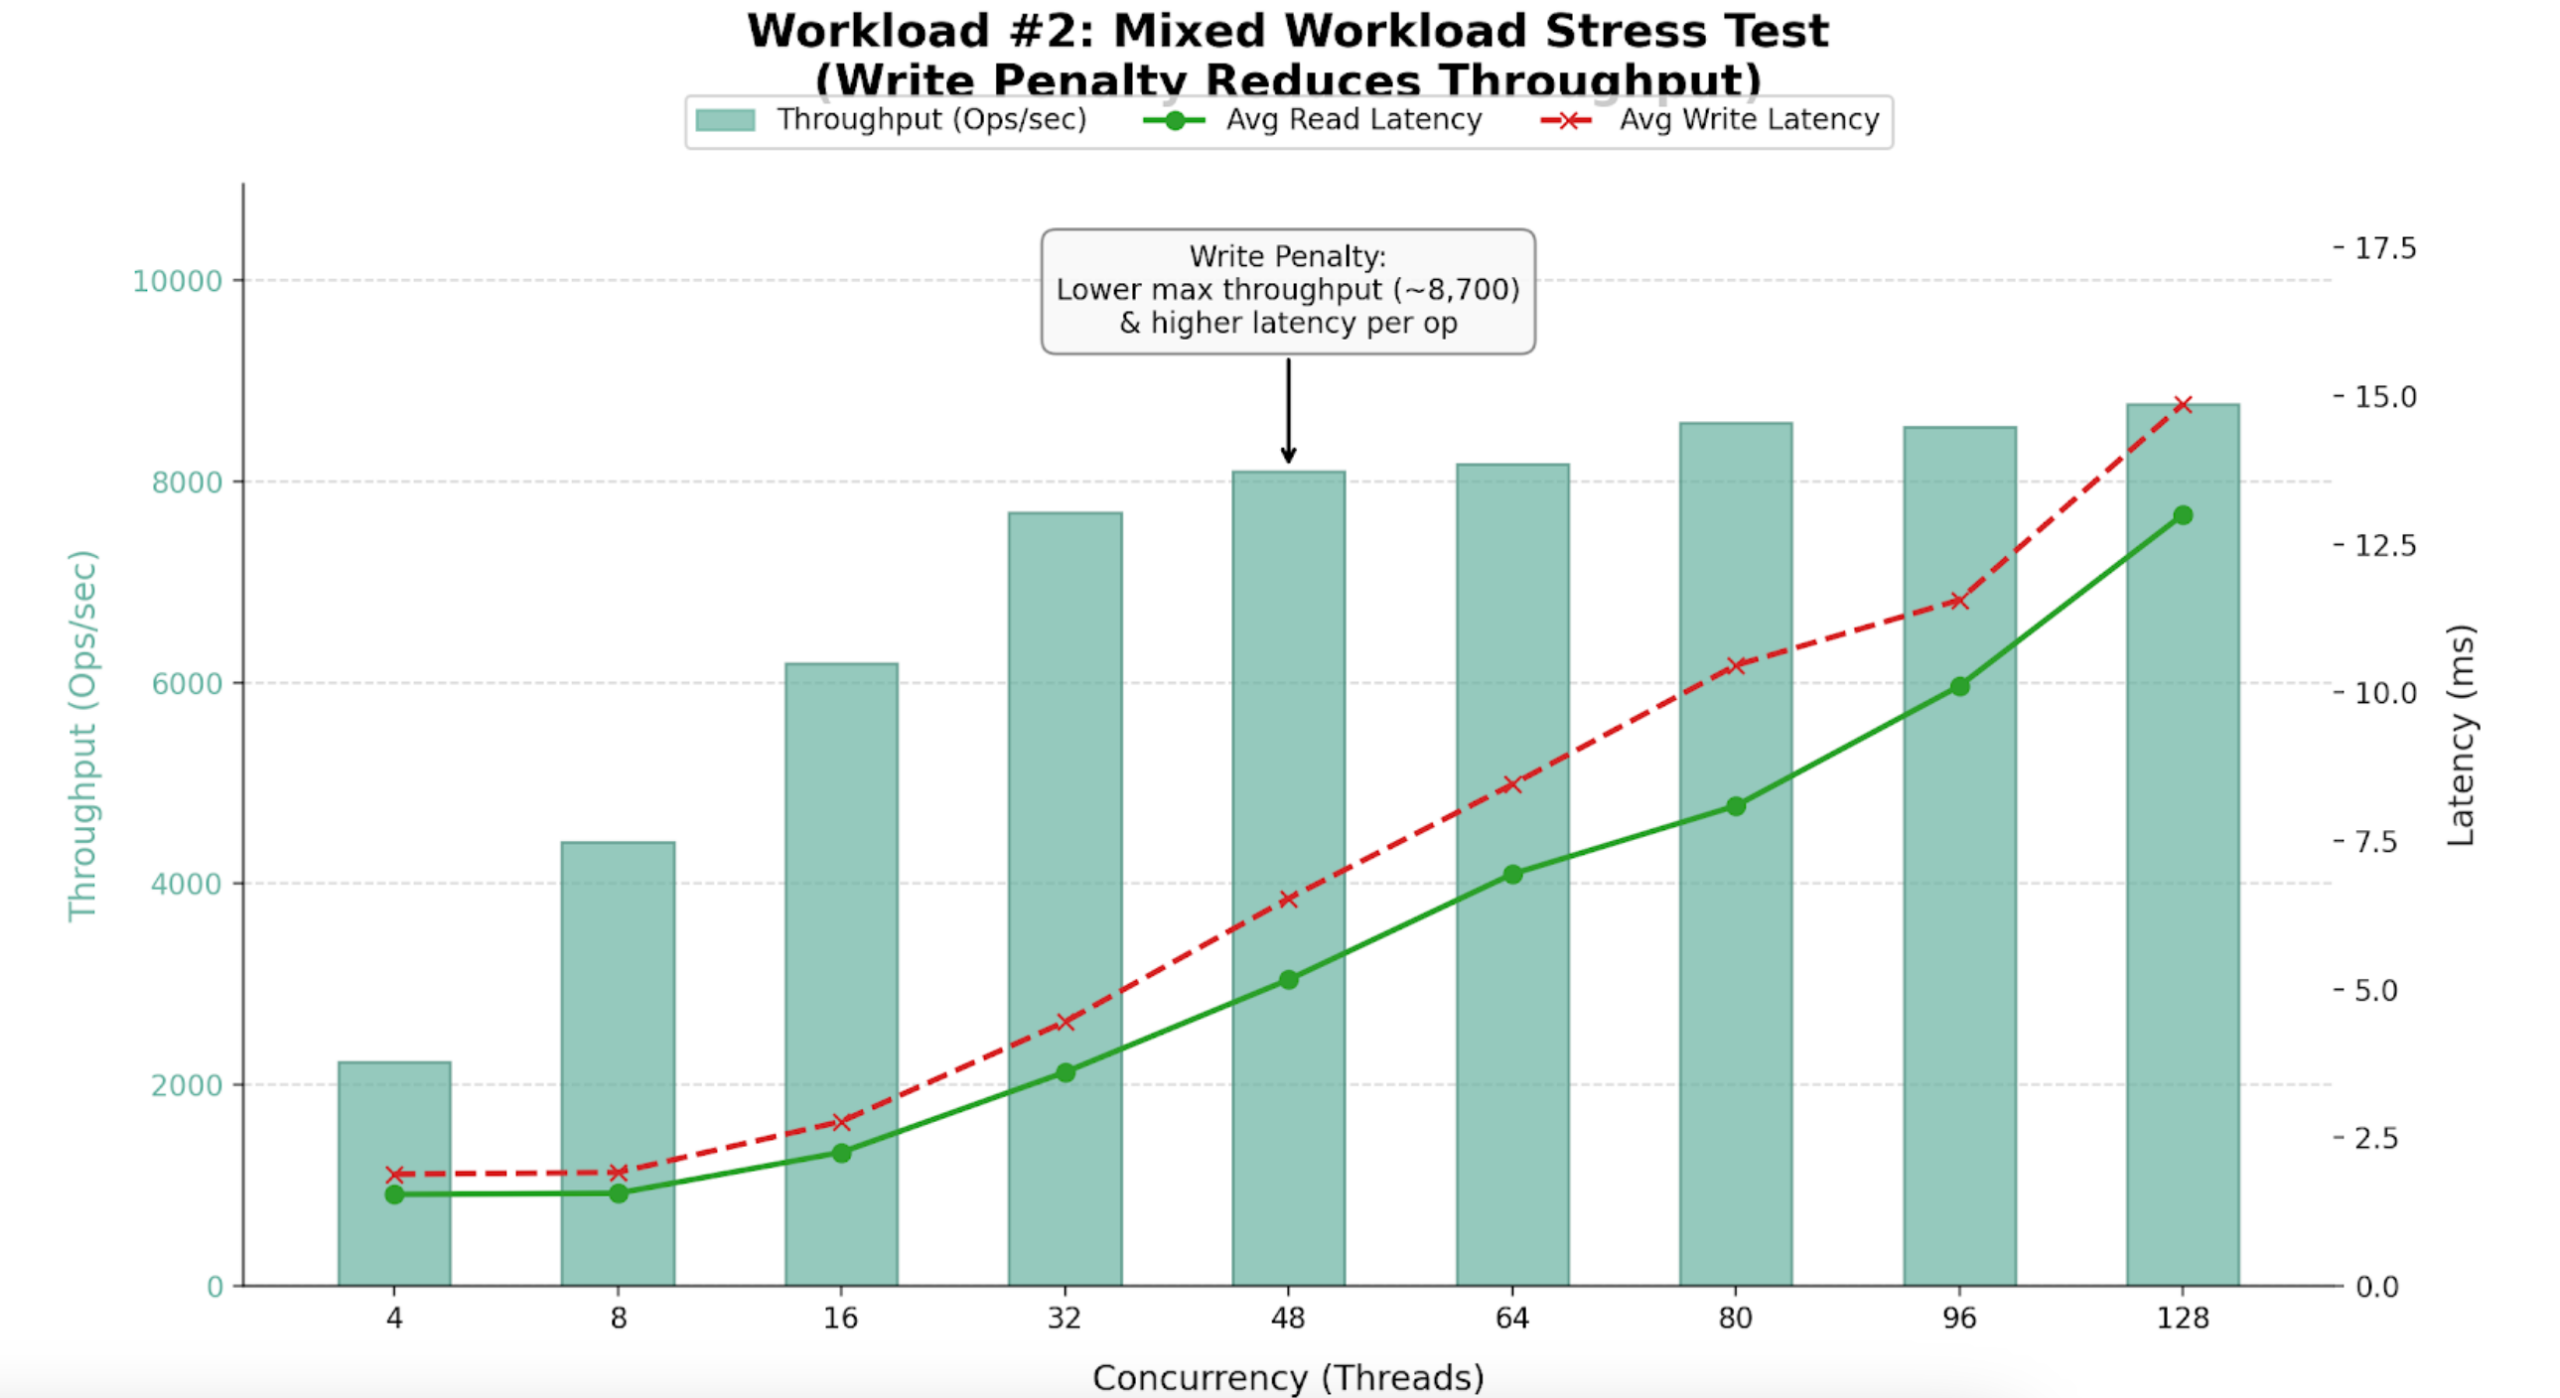
Following our baseline scenario, we conducted a mixed workload test (54% Reads, 46% Writes), using the same query definitions as the first workload.
|
1 2 3 |
for x in 4 8 16 32 48 64 80 96 128; do PLGM_PASSWORD=**** PLGM_CONCURRENCY=${x} PLGM_QUERIES_PATH=queries.json PLGM_REPLICASET_NAME="" PLGM_URI="mongodb://dan-ps-lab-mongos00.tp.int.percona.com:27017,dan-ps-lab-mongos01.tp.int.percona.com:27017" ./plgm_linux config_plgm.yaml ; sleep 15; done |
| Workers (Threads) | Throughput (Ops/Sec) | Avg Read Latency (ms) | Avg Write Latency (ms) | Efficiency Verdict |
| 4 | 2,225 | 1.54 | 1.88 | Underutilized |
| 16 | 6,195 | 2.25 | 2.77 | High Efficiency |
| 32 | 7,689 | 3.60 | 4.45 | Sweet Spot |
| 48 | 8,096 | 5.16 | 6.53 | Saturation Begins |
| 64 | 8,174 | 6.94 | 8.45 | Max Stability |
| 96 | 8,545 | 10.11 | 11.56 | Diminishing Returns |
| 128 | 8,767 | 13.00 | 14.86 | Oversaturated |
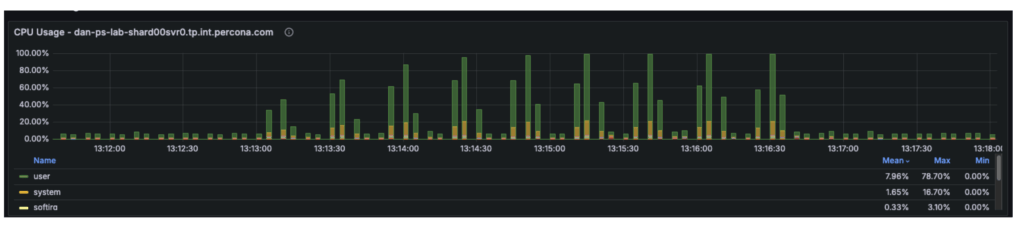
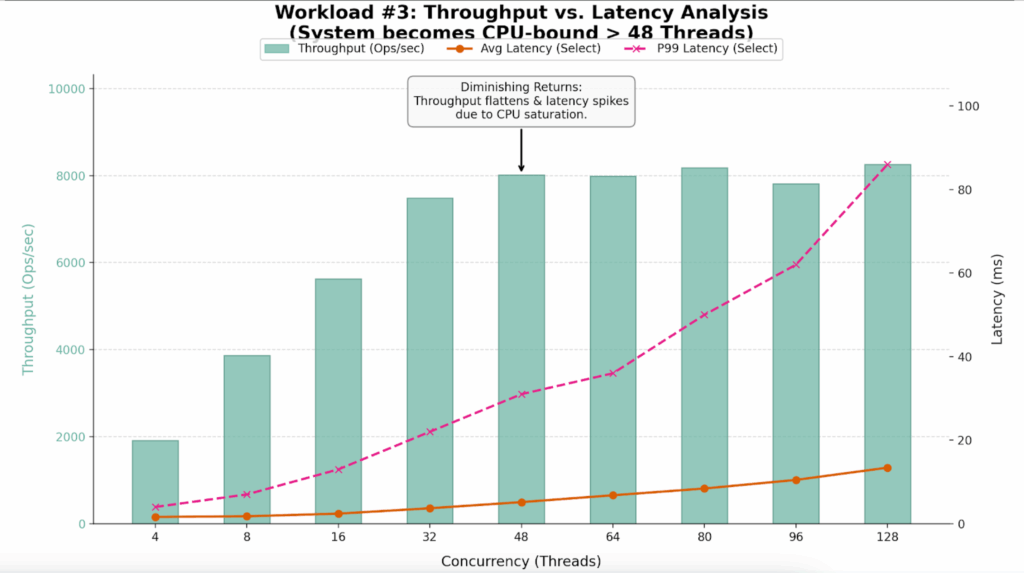
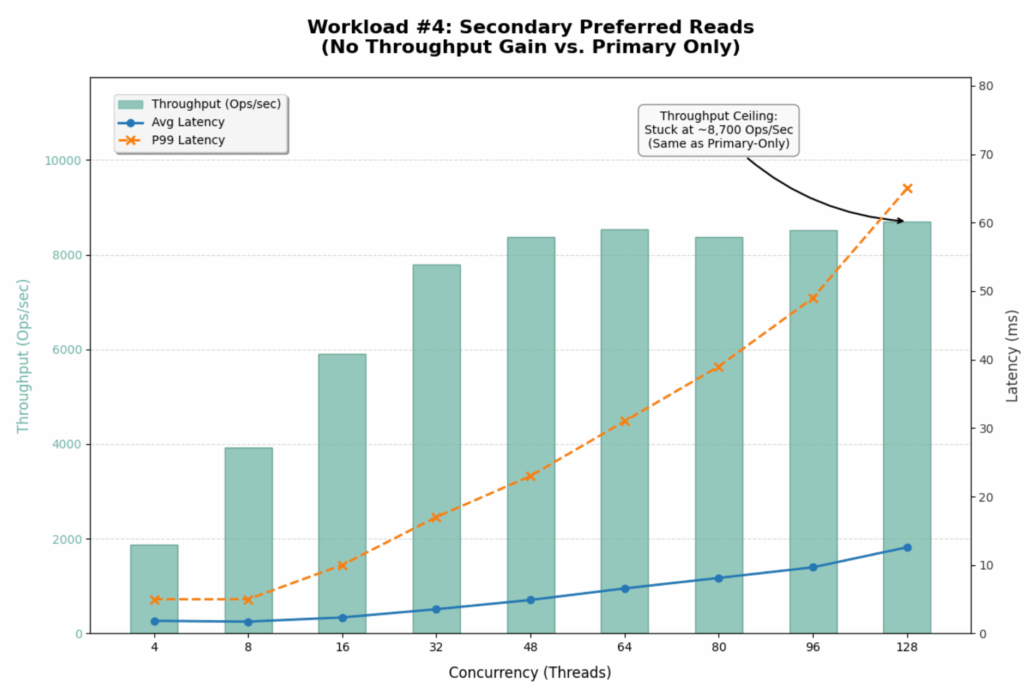
The third workload was executed using a different workload definition (the default), in contrast to the previous two tests that used queries.json. This workload was also a mixed workload test (54% reads and 46% writes). We conducted an analysis to identify the point at which hardware limitations began introducing scalability constraints in the system. By correlating plgm’s granular throughput data with system telemetry, we were able to pinpoint the specific resource bottleneck responsible for the performance plateau.
|
1 2 3 |
for x in 4 8 16 32 48 64 80 96 128; do PLGM_PASSWORD=**** PLGM_CONCURRENCY=${x} PLGM_REPLICASET_NAME="" PLGM_URI="mongodb://dan-ps-lab-mongos00.tp.int.percona.com:27017,dan-ps-lab-mongos01.tp.int.percona.com:27017" ./plgm_linux config_plgm.yaml ; sleep 15; done |
The table below highlights the “Diminishing Returns” phase clearly visible in this run.
| Workers (Threads) | Throughput (Ops/Sec) | Avg Latency (ms) | P99 Latency (ms) | Efficiency Verdict |
| 4 | 1,909 | 1.62 | 4.00 | Underutilized |
| 16 | 5,631 | 2.40 | 13.00 | Linear Scaling |
| 32 | 7,488 | 3.69 | 22.00 | Sweet Spot |
| 48 | 8,014 | 5.16 | 31.00 | Saturation Point |
| 64 | 7,991 | 6.80 | 36.00 | Plateau |
| 80 | 8,179 | 8.42 | 50.00 | Latency Spike |
| 96 | 7,811 | 10.48 | 62.00 | Performance Loss |
| 128 | 8,256 | 13.41 | 86.00 | Severe Queuing |
Enabling secondary reads could be one of the most impactful “quick wins” for certain workload configurations. The sections below explain why this change could be beneficial, how much improvement it can provide, and the trade-offs involved.
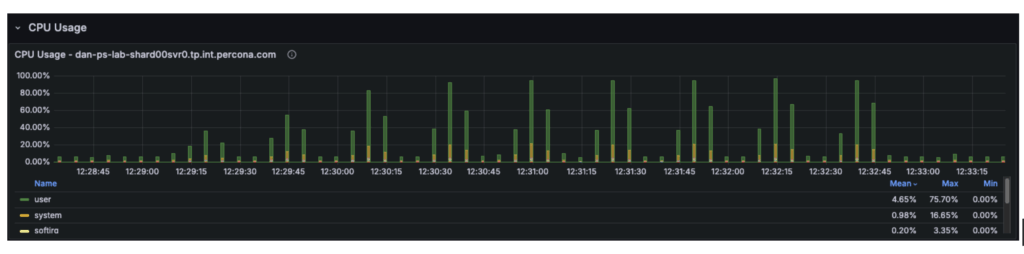
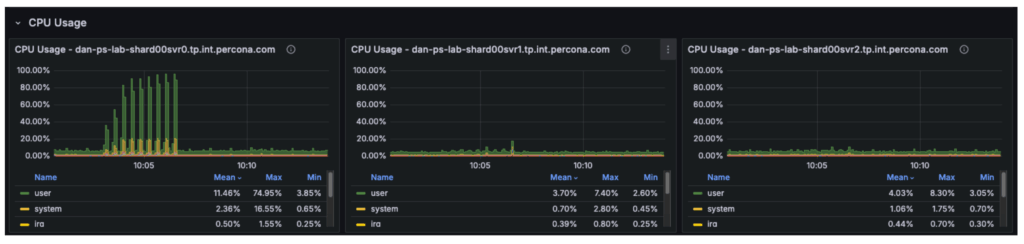
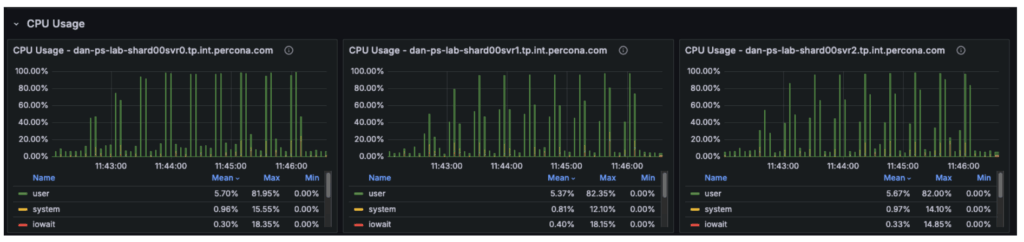
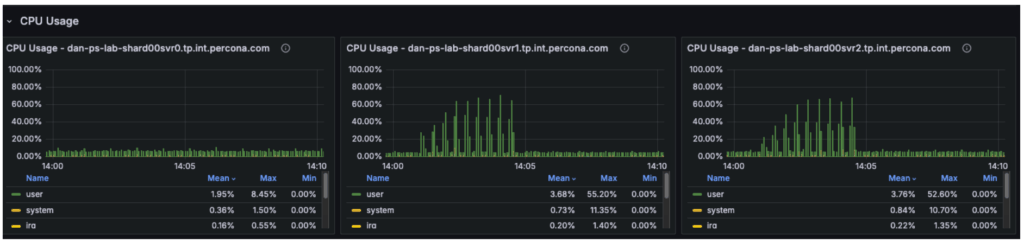
The cluster is a three-node replica set, and our observations were as follows:
Although the cluster has 12 vCPUs in total, the workload is constrained by only 4 vCPUs on the primary. The remaining 8 vCPUs on the secondary nodes are underutilized.
With secondary reads enabled:
Overall cluster throughput should increase from approximately 8,700 ops/sec to 12,000+ ops/sec, with the remaining limit determined primarily by the primary node’s write capacity.
The graph below illustrates that in previous tests, the secondary nodes carried almost no workload, while the primary was fully saturated.
The “catch” is stale reads. MongoDB replication is asynchronous. There is a delay (usually milliseconds) between data being written to the Primary and appearing on the Secondary.
To validate our assumptions, we can reconfigure PLGM, rather than making any changes to the infrastructure. This is one of the key advantages of using a benchmarking tool like plgm: you can modify workload behavior through configuration instead of altering the environment.
PLGM supports providing additional URI parameters either through its configuration file or via environment variables. We will use an environment variable so that no configuration files need to be modified. (For more details on available options, you can run ./plgm_linux –help or refer to the documentation)
We will run the same mixed workload as above and compare the results using the following setting:
|
1 |
PLGM_READ_PREFERENCE=secondaryPreferred |
|
1 2 3 |
for x in 4 8 16 32 48 64 80 96 128; do PLGM_PASSWORD=**** PLGM_CONCURRENCY=${x} PLGM_REPLICASET_NAME="" PLGM_READ_PREFERENCE="secondaryPreferred" PLGM_URI="mongodb://dan-ps-lab-mongos00.tp.int.percona.com:27017,dan-ps-lab-mongos01.tp.int.percona.com:27017" ./plgm_linux config_plgm.yaml ; sleep 15; done |
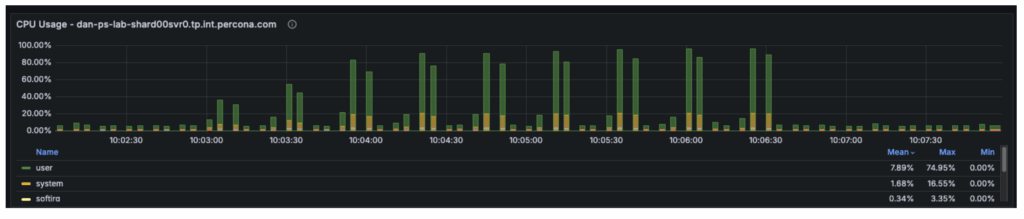
The introduction of readPreference=secondaryPreferred yielded almost no performance improvement. In fact, it slightly degraded performance at high concurrency.
| Metric | Primary Only | Secondary Preferred | Change |
| Max Throughput | ~8,700 Ops/Sec | ~8,700 Ops/Sec | 0% (No Gain) |
| Saturation Point | ~48 Threads | ~48 Threads | Identical |
| P99 Latency (128 Threads) | 86 ms | 65 ms | ~24% Better |
| Avg Select Latency (128 Threads) | 13.41 ms | 12.59 ms | Marginal Gain |
This result strongly suggests that the Secondaries were already busy or that the bottleneck is not purely CPU on the Primary.
Offloading reads to secondaries did not unlock hidden capacity for this specific write-heavy workload. The cluster is fundamentally limited by its ability to process the 46% write volume.
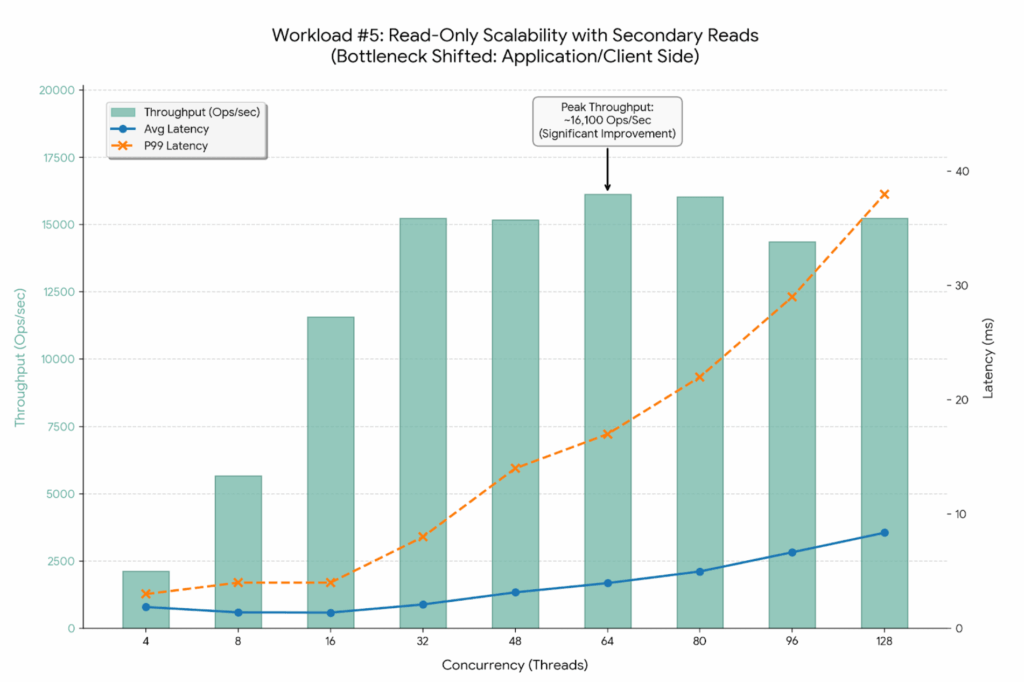
By switching to 100% Reads (PLGM_FIND_PERCENT=100) combined with Secondary Reads (PLGM_READ_PREFERENCE=secondaryPreferred), we have successfully shifted the bottleneck away from the single Primary node. The improvement is dramatic.
|
1 2 3 |
for x in 4 8 16 32 48 64 80 96 128; do PLGM_FIND_PERCENT=100 PLGM_PASSWORD=**** PLGM_CONCURRENCY=${x} PLGM_REPLICASET_NAME="" PLGM_READ_PREFERENCE="secondaryPreferred" PLGM_URI="mongodb://dan-ps-lab-mongos00.tp.int.percona.com:27017,dan-ps-lab-mongos01.tp.int.percona.com:27017" ./plgm_linux config_plgm.yaml ; sleep 15; done |
The graph below visualizes this new “unlocked” scalability. Notice how the latency lines (Blue and Orange) stay much flatter for much longer compared to previous tests.
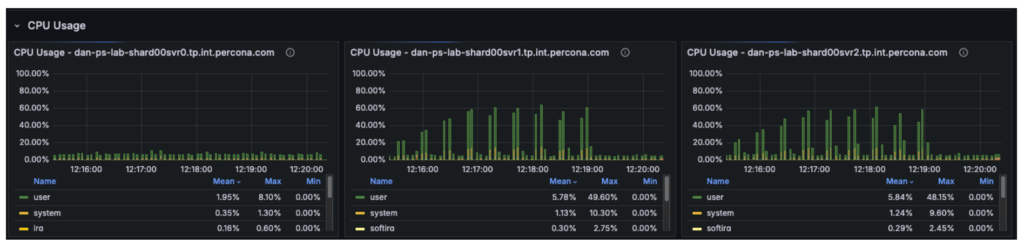
The CPU metrics and “Command Operations” charts confirm our hypothesis regarding the shift in resource utilization:
This represents the ideal outcome of a scaling exercise: the database has been tuned so effectively that it is no longer the weak link in the application stack.
By optimizing the workload configuration, we achieved significant improvements across all key metrics:
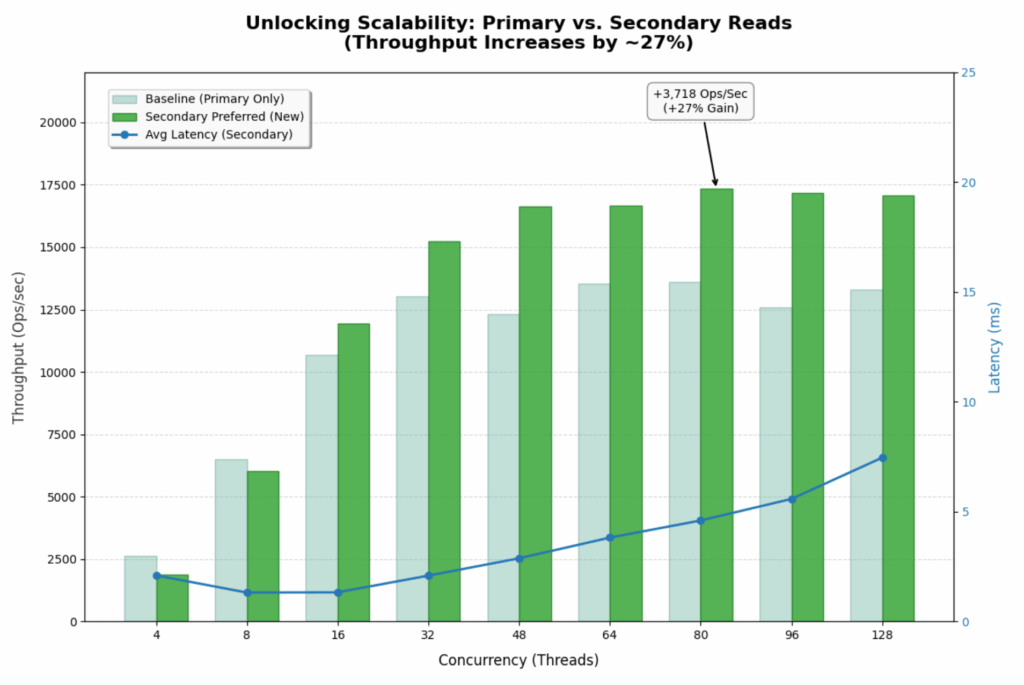
This workload represents the ideal scenario for a read-heavy application. It uses the same workload as the baseline test, with the only difference being the implementation of the secondaryPreferred option. By shifting 100% of the read traffic to the two secondary nodes, the system effectively triples its read capacity compared to the single-primary-node baseline.
|
1 2 3 4 |
for x in 4 8 16 32 48 64 80 96 128; do PLGM_READ_PREFERENCE=secondaryPreferred PLGM_PASSWORD=**** PLGM_CONCURRENCY=${x} PLGM_QUERIES_PATH=queries.json PLGM_FIND_PERCENT=100 PLGM_REPLICASET_NAME="" PLGM_URI="mongodb://dan-ps-lab-mongos00.tp.int.percona.com:27017,dan-ps-lab-mongos01.tp.int.percona.com:27017" ./plgm_linux config_plgm.yaml ; sleep 15; done |
The graph below shows how the throughput bars continue to climb steadily all the way to 80-96 threads. The system is no longer hitting a hard “wall” at 48 threads.
By using PLGM (Percona Load Generator for MongoDB) and telemetry, we were able to do far more than just “stress test” the database. We were able to isolate variables and incrementally step up concurrency. This precision allowed us to test different scenarios and tell a better story:
Our final test revealed an important shift in system behavior: the database is no longer the primary bottleneck. While backend nodes were operating at only ~50% utilization, overall throughput plateaued at approximately ~18k Ops/Sec, indicating the constraint has moved upstream. The performance limit now likely resides in the application server, the network layer, or the load generator itself, and future optimization efforts should focus on the following areas:
This is the ultimate goal of database benchmarking: to tune the data layer so effectively that it becomes invisible, forcing you to look elsewhere for the next leap in performance.
Resources
RELATED POSTS