
MySQL uses Redo Logs internally during crash recovery to correct data written by incomplete transactions. But how do you know what the right Redo Log size is? We will walk through how to figure that out in this blog.
We already have a couple of posts related to this topic. “How to calculate a good InnoDB log file size” and “How to Choose the MySQL innodb_log_file_size.” The first one has the formula I’ll mention in this blog, and the second has more details regarding Redo Logs. Most of it is still valid, just replace innodb_log_file_size / innodb_log_files_in_group with innodb_redo_log_capacity.
So in this one, I want to focus on two things:
The TL;DR for the second point is:
PMM graphs with related information (in MySQL / InnoDB Details / InnoDB Logging):
Formula:
|
1 2 3 4 |
mysql> pager grep sequence; show engine innodb statusG select sleep(60); show engine innodb statusG nopager; mysql> select (<second_value> - <first_value>) / 1024 / 1024 as MB_per_min; NOTE: This formula is from the first post mentioned above; it's used to see how many MB have been written to the log in one minute. |
Starting from MySQL 8.0.30, the variable that should be tuned for optimizing the Redo Logs is innodb_redo_log_capacity, and we start with good news here: It’s dynamic! So you won’t have downtime if you need to tune this.
innodb_log_file_size and innodb_log_files_in_group:
By default, InnoDB creates two redo log files (innodb_log_files_in_group) in the data directory, named ib_logfile0 and ib_logfile1, and writes to these files in a circular fashion; each with a size of innodb_log_file_size.
innodb_redo_log_capacity
InnoDB creates 32 files (each of them with a size of innodb_redo_log_capacity / 32) in the #innodb_redo directory in the data directory unless a different directory was specified by the innodb_log_group_home_dir variable.
So, with the new variable in place, how is the value calculated?
Just as a reminder about why you want to tune this: If the Redo Log is full, MySQL must execute a checkpoint (flushing from InnoDB Buffer Pool to disk). If your Redo Logs are small, checkpoints will happen more often, adding more I/O and impacting the performance.
A rule of thumb here is to configure the Redo Logs to be able to hold one hour of traffic, thus letting checkpointing perform in a smooth, less aggressive way. Otherwise, the flushing may happen at the worst time possible due to the checkpoint being unavoidable.
To have a general idea, I executed some basic mysqlslap commands on a loop to create load in the database. This is far from a real scenario test, but it should help us in this particular case.
|
1 |
$ while true; do mysqlslap --auto-generate-sql -vv --concurrency=100 --iterations=200 --number-char-cols=7 --number-int-cols=10; |
Testing the “rule of thumb formula” shared in the first blog post:
|
1 2 3 4 5 6 7 8 9 10 11 12 13 |
mysql> pager grep sequence; show engine innodb statusG select sleep(60); show engine innodb statusG nopager; Log sequence number 3182015832 Log sequence number 3252604221 mysql> select (3252604221 - 3182015832) / 1024 / 1024 as MB_per_min; +-------------+ | MB_per_min | +-------------+ | 67.31833363 | +-------------+ |
I tested a couple of times again, with the following results:
|
1 2 3 4 5 6 |
mysql> select (3428540758 - 3366312894) / 1024 / 1024 as MB_per_min; +-------------+ | MB_per_min | +-------------+ | 59.34511566 | +-------------+ |
|
1 2 3 4 5 6 |
mysql> select (3517465187 - 3449605532) / 1024 / 1024 as MB_per_min; +-------------+ | MB_per_min | +-------------+ | 64.71601009 | +-------------+ |
As we can see, with a consistent load, the rule of thumb gives an average of 63.8 MB per minute (3.74 GB per hour).
This works, but it’s manual, and you need to be online and run this a few times during peak hours.
Inside PMM, you can find a lot of useful graphs, and for this blog, I will focus on MySQL / InnoDB Details / InnoDB Logging.
The first graph I want to point out is Redo Generation Rate. I’ve filtered to see the timeframe when mysqlslap was running on a loop, and the value is 1.1 MB/s (we can extrapolate to 66 MB per minute or 3.87 GB per hour, almost the same as the result from the formula above).
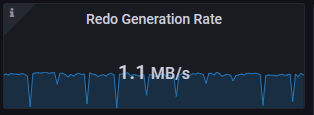
With that being said, you could have a better answer about how much redo is being created using this graph alone, and you didn’t need to use the commands and manually check when the load is running, you can check it later on or even check it for a particular time frame. For example, if your biggest load happens over the weekends, you don’t want to be online only to calculate the proper settings.
There’s yet another graph in PMM you can use to check the hourly usage of Redo Logs in your database: InnoDB Log File Usage Hourly; in this one, you can see the pattern over the last 24 hours, and at first glance, it pops to the eye if you need to increase/decrease your settings.
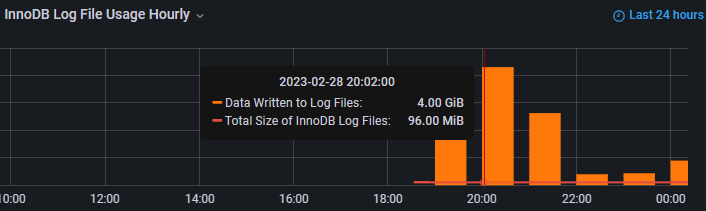
NOTE: I’ve truncated the last 24 hours’ graph to avoid the image being too small here.
See the spike around 20:00 hours in the graphic above, which matches the hour the mysqlslap was running “aggressively.” And if you’ve been following the maths, it matches the other two checks:
Even though the variables changed recently, you still need to monitor and configure your Redo Logs, especially for write-heavy environments; to do that, you can still use the formula, or you can take advantage of PMM Graphs.
The formula can work as a first step but may lead to overconfiguring (or underconfiguring) your Redo Logs.
As with everything in MySQL, the more information you have about your environment before performing changes, the better results you’ll have. That’s why I suggest taking this a step further and check the details with PMM. If you’re not yet using PMM, it’s open source, and you can install it and start using it quickly. Check out our PMM Quickstart and talk to us in the forums if you have any questions or problems.
Percona Distribution for MySQL is the most complete, stable, scalable, and secure open-source MySQL solution available, delivering enterprise-grade database environments for your most critical business applications… and it’s free to use!
Resources
RELATED POSTS


