
 To follow up on my previous Kubernetes articles:
I would like to introduce a project which brings Kubernetes observability to the next level and provides major help in visualizing and diagnosing Kubernetes deployments.
The project is Coroot and it comes with the Community version Coroot Community Edition (source code at https://github.com/coroot/coroot) which you can install on your Kubernetes. The installation using helm charts is trivial:
|
1 2 3 |
helm repo add coroot https://coroot.github.io/helm-charts helm repo update helm install --namespace coroot --create-namespace coroot coroot/coroot |
Enabling port forwarding to access Coroot through the web:
|
1 |
kubectl port-forward -n coroot service/coroot 8080:8080 --address='0.0.0.0' |
The first you can see is the graph representing Kubernetes deployment. Why is it helpful? Let’s review what we can see in the plain Kubernetes:
List of pods:
|
1 2 3 4 5 6 7 8 9 10 11 12 13 14 15 16 17 18 19 20 21 22 |
kubectl get pods NAME READY STATUS RESTARTS AGE percona-server-mysql-operator-7bb68f7b6d-8mg4j 1/1 Running 0 2d20h cluster1-orc-0 2/2 Running 0 2d5h cluster1-orc-1 2/2 Running 0 2d5h cluster1-mysql-1 3/3 Running 1 (2d5h ago) 2d5h cluster1-orc-2 2/2 Running 0 2d5h cluster1-haproxy-0 2/2 Running 0 2d5h cluster1-haproxy-1 2/2 Running 0 2d5h cluster1-haproxy-2 2/2 Running 0 2d5h cluster1-mysql-2 3/3 Running 1 (2d5h ago) 2d5h cluster1-mysql-0 3/3 Running 1 (23h ago) 23h my-op-psmdb-operator-855dbfff5d-s8js5 1/1 Running 0 69m cluster2-orc-0 2/2 Running 0 58m cluster2-orc-1 2/2 Running 0 58m cluster2-mysql-0 3/3 Running 0 58m cluster2-haproxy-0 2/2 Running 0 57m cluster2-haproxy-1 2/2 Running 0 57m cluster2-haproxy-2 2/2 Running 0 57m cluster2-mysql-1 3/3 Running 1 (57m ago) 58m cluster2-orc-2 2/2 Running 0 57m cluster2-mysql-2 3/3 Running 1 (56m ago) 57m |
And the list of services:
|
1 2 3 4 5 6 7 8 9 10 11 12 13 14 15 16 17 18 19 |
kubectl get svc NAME TYPE CLUSTER-IP EXTERNAL-IP PORT(S) AGE kubernetes ClusterIP 10.43.0.1 <none> 443/TCP 2d20h cluster1-mysql-primary ClusterIP 10.43.252.22 <none> 3306/TCP,33062/TCP,33060/TCP,6033/TCP 2d5h cluster1-mysql-unready ClusterIP None <none> 3306/TCP,33062/TCP,33060/TCP,6033/TCP 2d5h cluster1-mysql ClusterIP None <none> 3306/TCP,33062/TCP,33060/TCP,6033/TCP 2d5h cluster1-orc ClusterIP None <none> 3000/TCP,10008/TCP 2d5h cluster1-orc-0 ClusterIP 10.43.236.23 <none> 3000/TCP,10008/TCP 2d5h cluster1-orc-1 ClusterIP 10.43.12.1 <none> 3000/TCP,10008/TCP 2d5h cluster1-orc-2 ClusterIP 10.43.12.67 <none> 3000/TCP,10008/TCP 2d5h cluster1-haproxy ClusterIP 10.43.196.248 <none> 3306/TCP,3307/TCP,3309/TCP 2d5h cluster2-mysql-primary ClusterIP 10.43.219.150 <none> 3306/TCP,33062/TCP,33060/TCP,6033/TCP 59m cluster2-mysql-unready ClusterIP None <none> 3306/TCP,33062/TCP,33060/TCP,6033/TCP 59m cluster2-mysql ClusterIP None <none> 3306/TCP,33062/TCP,33060/TCP,6033/TCP 59m cluster2-orc ClusterIP None <none> 3000/TCP,10008/TCP 59m cluster2-orc-0 ClusterIP 10.43.226.204 <none> 3000/TCP,10008/TCP 59m cluster2-orc-1 ClusterIP 10.43.122.217 <none> 3000/TCP,10008/TCP 59m cluster2-orc-2 ClusterIP 10.43.221.34 <none> 3000/TCP,10008/TCP 59m cluster2-haproxy ClusterIP 10.43.41.95 <none> 3306/TCP,3307/TCP,3309/TCP 59m |
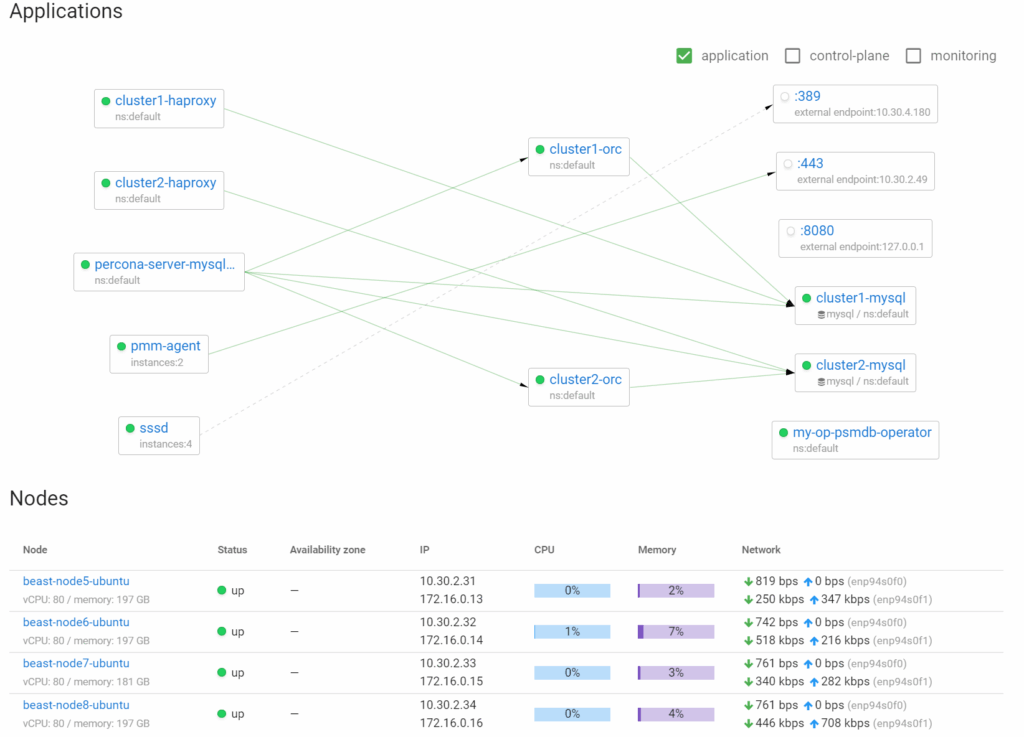
I do not know how this is for you, but I have a hard time processing these lists, while Coroot offers visual help. Coroot is a web application, so there will be a lot of screenshots.
There is a glance overview of my deployments, including physical nodes:
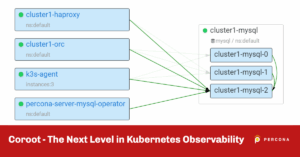
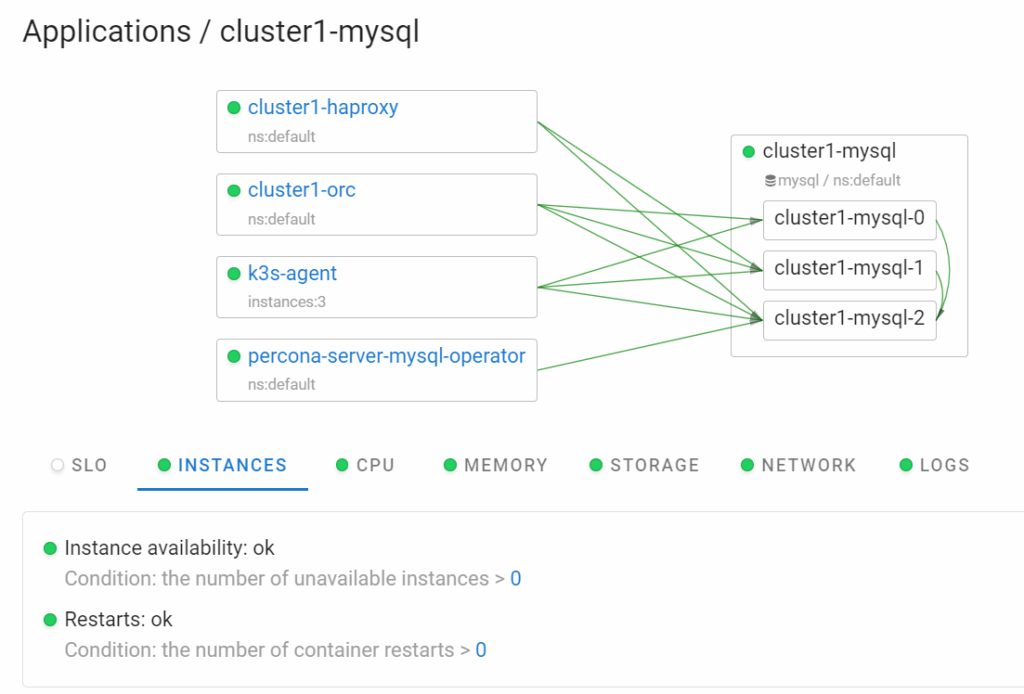
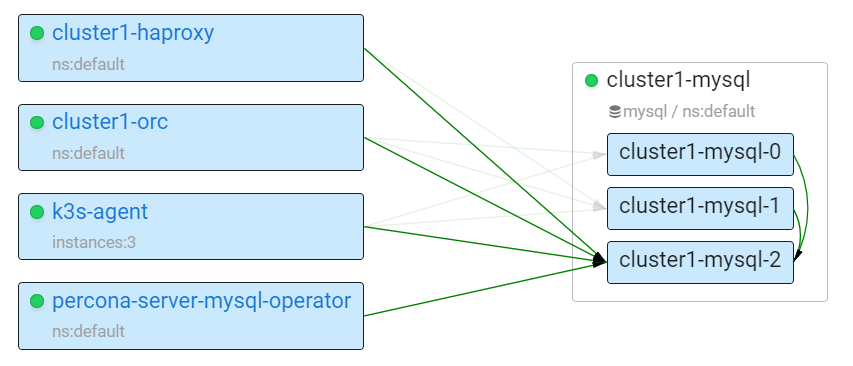
And from there we can drill down into individual components, for example, cluster1-mysql:
And there you can highlight important relations, like for HAProxy:
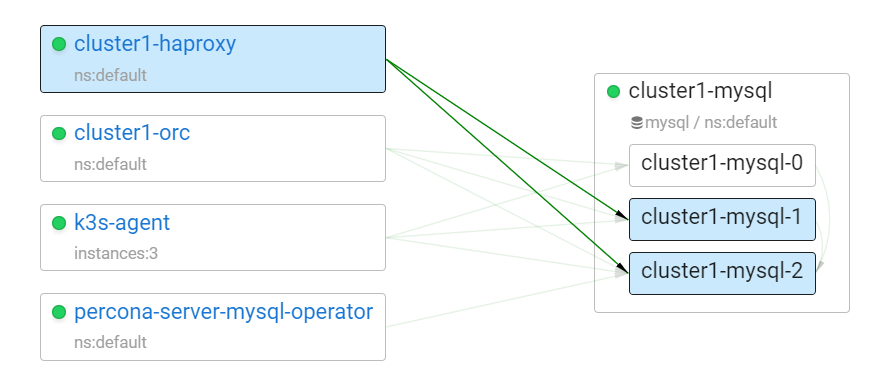
We can see that it handles pod mysql-1 and mysql-2 right now, even for the MySQL setup itself:
We can see mysql-2 is the primary and mysql-0 and mysql-1 are replicas. There is also a network layout:
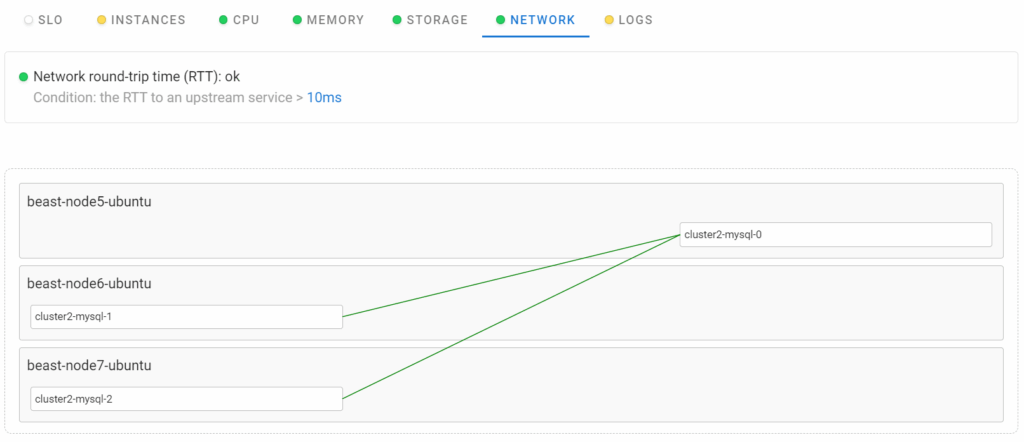
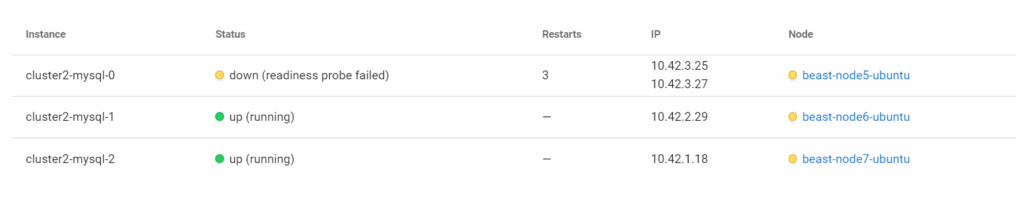
This shows network connections between different physical nodes and pods mapping to nodes. If we run a scenario with MySQL primary failure (similar to what we did in Using Percona Kubernetes Operators With K3s Part 2: Percona Server for MySQL Operator), it also can be visualized.
Node failure:
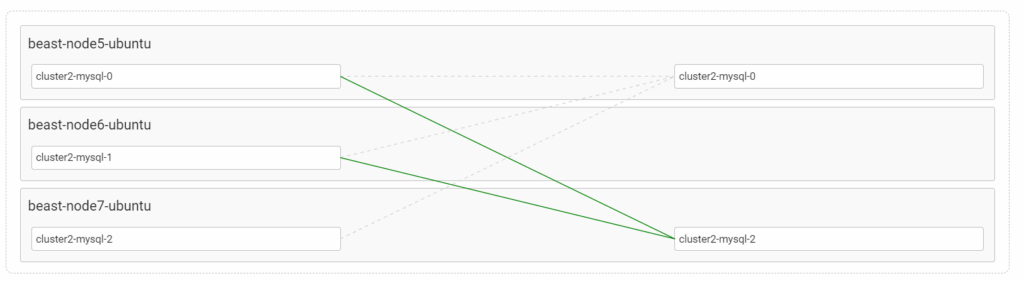
Primary failover from mysql-0 to mysql-2:
In general, Coroot offers visibility into a variety of problems you may encounter in Kubernetes, and there are more details on their Failurepedia page.
In my view, Coroot brings the visibility of Kubernetes deployments to the next level and is a must-have tool for the diagnostics and troubleshooting of Kubernetes workloads. If you run your application in Kubernetes, I recommend you give it a try!
Resources
RELATED POSTS