 In this v2.30 release, we have focused on improving Percona Monitoring and Management (PMM) for usability, refining the dashboards (effortless root cause analysis), Database as a Service (DBaaS) functionality, and seamless onboarding to align with your needs. Your valuable feedback along with your contributions is important to us. Please keep contributing to take PMM to the next level and make the world more open source.
Note that you can get started with PMM in minutes with the PMM Demo to check out the latest version of PMM V2.30.
Here are some of the highlights in PMM V2.30:
We created new experimental dashboards based on your feedback and requests. The new Home Dashboard was designed to gain actionable insights while monitoring numerous nodes or services without excessive loading time. Our objective with the all-new MongoDB dashboards is to provide collections and document-based metrics as requested by the PMM users.
Important: These experimental dashboards are subject to change. It is recommended to use these dashboards for testing purposes only.
The redesigned and improved new Home Dashboard was introduced as a more user-friendly and insightful experimental dashboard in PMM version 2.30.0. The driver behind the new Home Dashboard design is your requests, and feedback about long loading time issues of the existing Home dashboard for monitoring a large number of nodes or services in PMM. Repeated rows (for a large number of nodes) for each node on the dashboard can take a considerable time to load the Home Dashboard UI, which was reported as a performance problem by some users. So we reworked the Home dashboard to provide a boost in performance for monitoring big scales. Our new experimental dashboard ensures fast retrieval of data on the Home Dashboard. For more information, read more on experimental Home Dashboard metrics.
Please do not hesitate to give feedback by posting your comments here.
After dozens of calls with PMM users who monitor MongoDB metrics in PMM, we collected all the feedback and put them together on new experimental dashboards. (Special thanks to Kimberly Wilkins and Michael Patrick from Percona) We have introduced the following experimental dashboards to collect more metrics and data for MongoDB and present them in a more structured way with new dashboards:
This dashboard contains panels for data about the hottest collections in the MongoDB database. For more information, see the documentation.
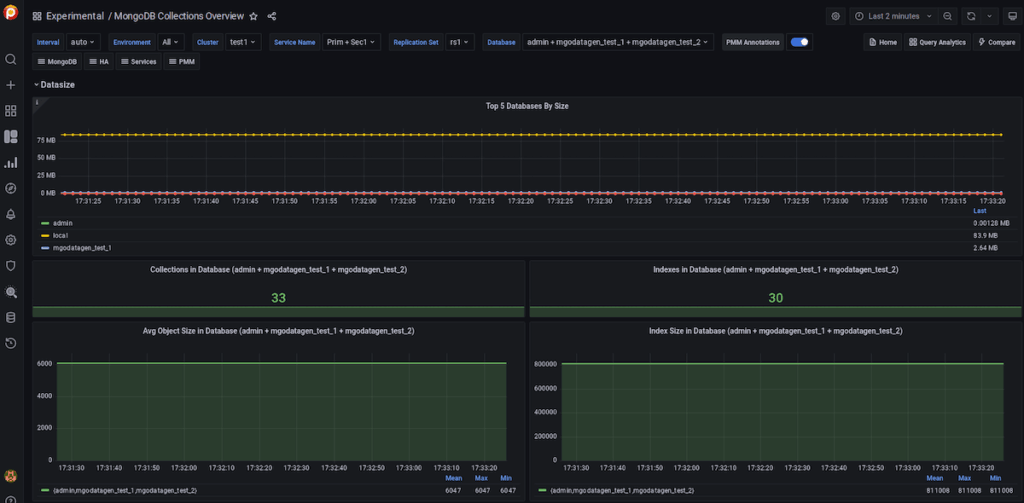
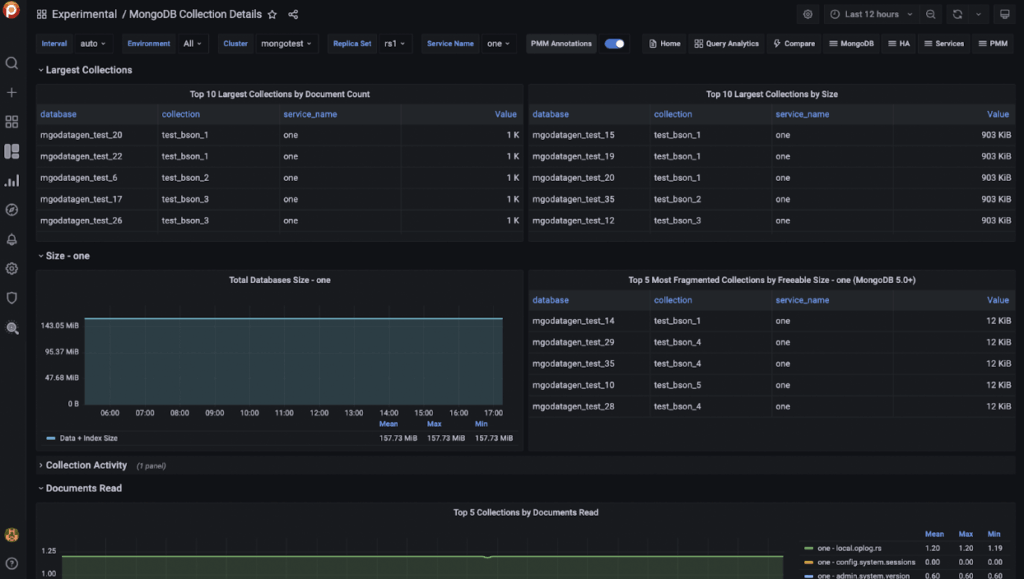
This experimental dashboard provides detailed information about the top collections by document count, size, and document read for MongoDB databases. For more information, see the documentation.
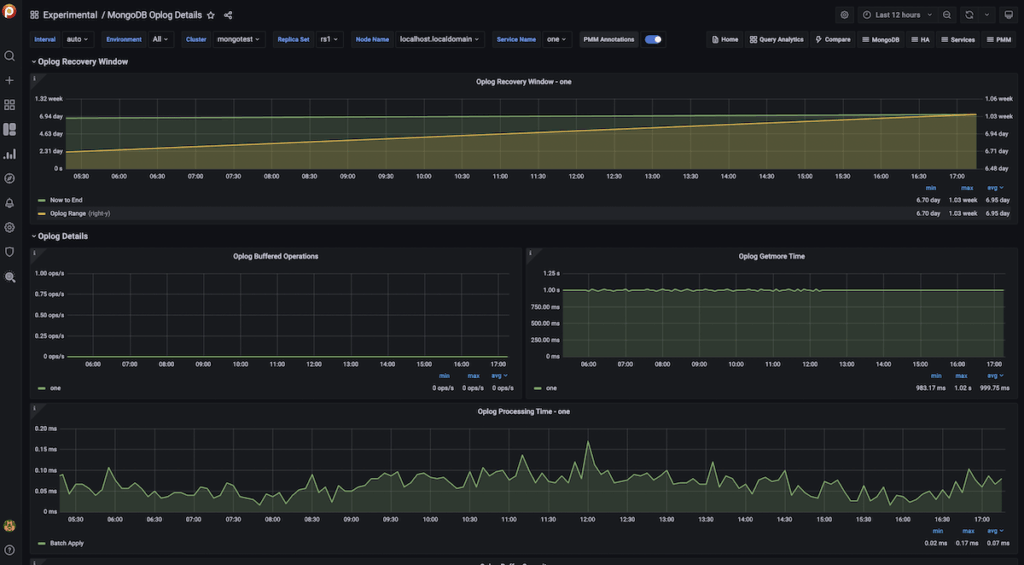
This real-time dashboard contains oplog details such as Recovery Window, Processing Time, Buffer Capacity, and Oplog Operations. For more information, see the documentation.
Usability is one of the themes on our roadmap and is now more important for us to give the best PMM experience in minutes. So we applied a couple of improvements to the configuration and deployment of DBaaS database clusters:
PMM now supports Percona Operator for MySQL based on Percona XtraDB Cluster.
We’re working on a new main menu on top of the Grafana 9.1 menu structure and Vacuum Monitoring with a new experimental dashboard. If you have any feedback or suggestions, please get in touch with us.
Also, another topic on our next release agenda is Podman GA. Please share your experience/feedback with Podman.
Run PMM Server with Podman now!
We know that you’re waiting for news for Alerting in PMM and we’ll get back to you with good news in v2.31 by combining our Integrated Alerting with Grafana Alerting to make it easier for setup and management. Please follow our emails and release notes to be informed about upcoming releases.
We love our Community and team at Percona who help us to shape PMM and make it better!
Thank you for your collaboration on the new Home Dashboard:
Thank you for your collaboration on MongoDB dashboards:
Appreciate your feedback:
Resources
RELATED POSTS