 Percona announces the release of Percona Monitoring and Management 1.2.0 on July 14, 2017.
For installation instructions, see the Deployment Guide.
Changes in PMM Server
PMM Server 1.2.0 introduced the following changes:
New Features
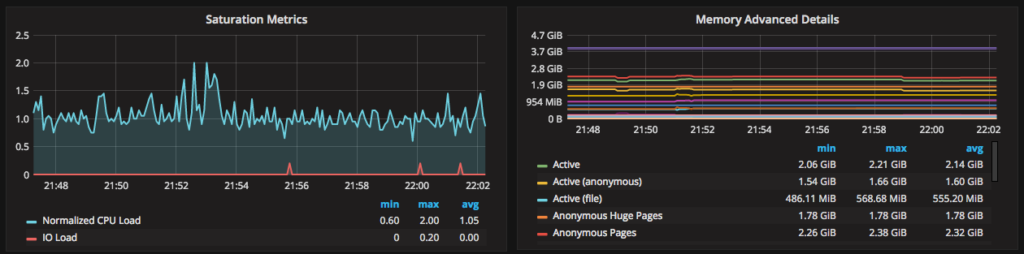
- PMM-737: New graphs in System Overview dashboard:
-
- Memory Advanced Details
- Saturation Metrics
- PMM-1090: Added ESXi support for PMM Server virtual appliance.
UI Fixes
- PMM-707: Fixed QPS metric in MySQL Overview dashboard to always show queries per second regardless of the selected interval.
- PMM-708: Fixed tooltips for graphs that displayed incorrectly.
- PMM-739, PMM-797: Fixed PMM Server update feature on the landing page.
- PMM-823: Fixed arrow padding for collapsible blocks in QAN.
- PMM-887: Disabled the Add button when no table is specified for showing query info in QAN.
- PMM-888: Disabled the Apply button in QAN settings when nothing is changed.
- PMM-889: Fixed the switch between UTC and local time zone in the QAN time range selector.
- PMM-909: Added message
No query example when no example for a query is available in QAN.
- PMM-933: Fixed empty tooltips for Per Query Stats column in the query details section of QAN.
- PMM-937: Removed the percentage of total query time in query details for the
TOTAL entry in QAN (because it is 100% by definition).
- PMM-951: Fixed the InnoDB Page Splits graph formula in the MySQL InnoDB Metrics Advanced dashboard.
- PMM-953: Enabled stacking for graphs in MySQL Performance Schema dashboard.
- PMM-954: Renamed Top Users by Connections graph in MySQL User Statistics dashboard to Top Users by Connections Created and added the Connections/sec label to the Y-axis.
- PMM-957: Refined titles for Client Connections and Client Questions graphs in ProxySQL Overview dashboard to mentioned that they show metrics for all host groups (not only the selected one).
- PMM-961: Fixed the formula for Client Connections graph in ProxySQL Overview dashboard.
- PMM-964: Fixed the gaps for high zoom levels in MySQL Connections graph on the MySQL Overview dashboard.
- PMM-976: Fixed Orchestrator handling by
supervisorctl.
- PMM-1129: Updated the MySQL Replication dashboard to support new
connection_name label introduced in mysqld_exporter for multi-source replication monitoring.
- PMM-1054: Fixed typo in the tooltip for the Settings button in QAN.
- PMM-1055: Fixed link to Query Analytics from Metrics Monitor when running PMM Server as a virtual appliance.
- PMM-1086: Removed HTML code that showed up in the QAN time range selector.
Bug Fixes
- PMM-547: Added warning page to Query Analytics app when there are no PMM Clients running the QAN service.
- PMM-799: Fixed Orchestrator to show correct version.
- PMM-1031: Fixed initialization of Query Profile section in QAN that broke after upgrading Angular.
- PMM-1087: Fixed QAN package building.
Other Improvements
- PMM-348: Added daily log rotation for nginx.
- PMM-968: Added Prometheus build information.
- PMM-969: Updated the Prometheus memory usage settings to leverage new flag. For more information about setting memory consumption by PMM, see FAQ.
Changes in PMM Client
PMM Client 1.2.0 introduced the following changes:
New Features
- PMM-1114: Added PMM Client packages for Debian 9 (“stretch”).
Bug Fixes
- PMM-481, PMM-1132: Fixed fingerprinting for queries with multi-line comments.
- PMM-623: Fixed
mongodb_exporter to display correct version.
- PMM-927: Fixed bug with empty metrics for MongoDB query analytics.
- PMM-1126: Fixed
promu build for node_exporter.
- PMM-1201: Fixed
node_exporter version.
About Percona Monitoring and Management
Percona Monitoring and Management (PMM) is an open-source platform for managing and monitoring MySQL and MongoDB performance. Percona developed it in collaboration with experts in the field of managed database services, support and consulting.
Percona Monitoring and Management is a free and open-source solution that you can run in your own environment for maximum security and reliability. It provides thorough time-based analysis for MySQL and MongoDB servers to ensure that your data works as efficiently as possible.
A live demo of PMM is available at pmmdemo.percona.com.
Please provide your feedback and questions on the PMM forum.


i can`t download the pmm manul from the percona website. the anti-robot plugin on the download page refuses me everytime。perhaps the our country’s GFW doesn`t familiar to the https://forms.hubspot.com. so could u send me a pdf type file to my e-mail? thks
Hi @psyduck, I’m sorry to hear our forms are causing issues for you. If you can send me a private note to emily@Percona.com I can send you the PDF requested.