
Percona has released a new Percona App for Grafana!
Are you using Grafana 3.x with Prometheus’ time-series database? Now there is a “Percona App” available on Grafana.net! The app provides a set of dashboards for MySQL performance and system monitoring with Prometheus’ datasource, and make it easy for users install them. The dashboards rely on the alias label in the Prometheus config and depend on the small patch applied on Grafana.
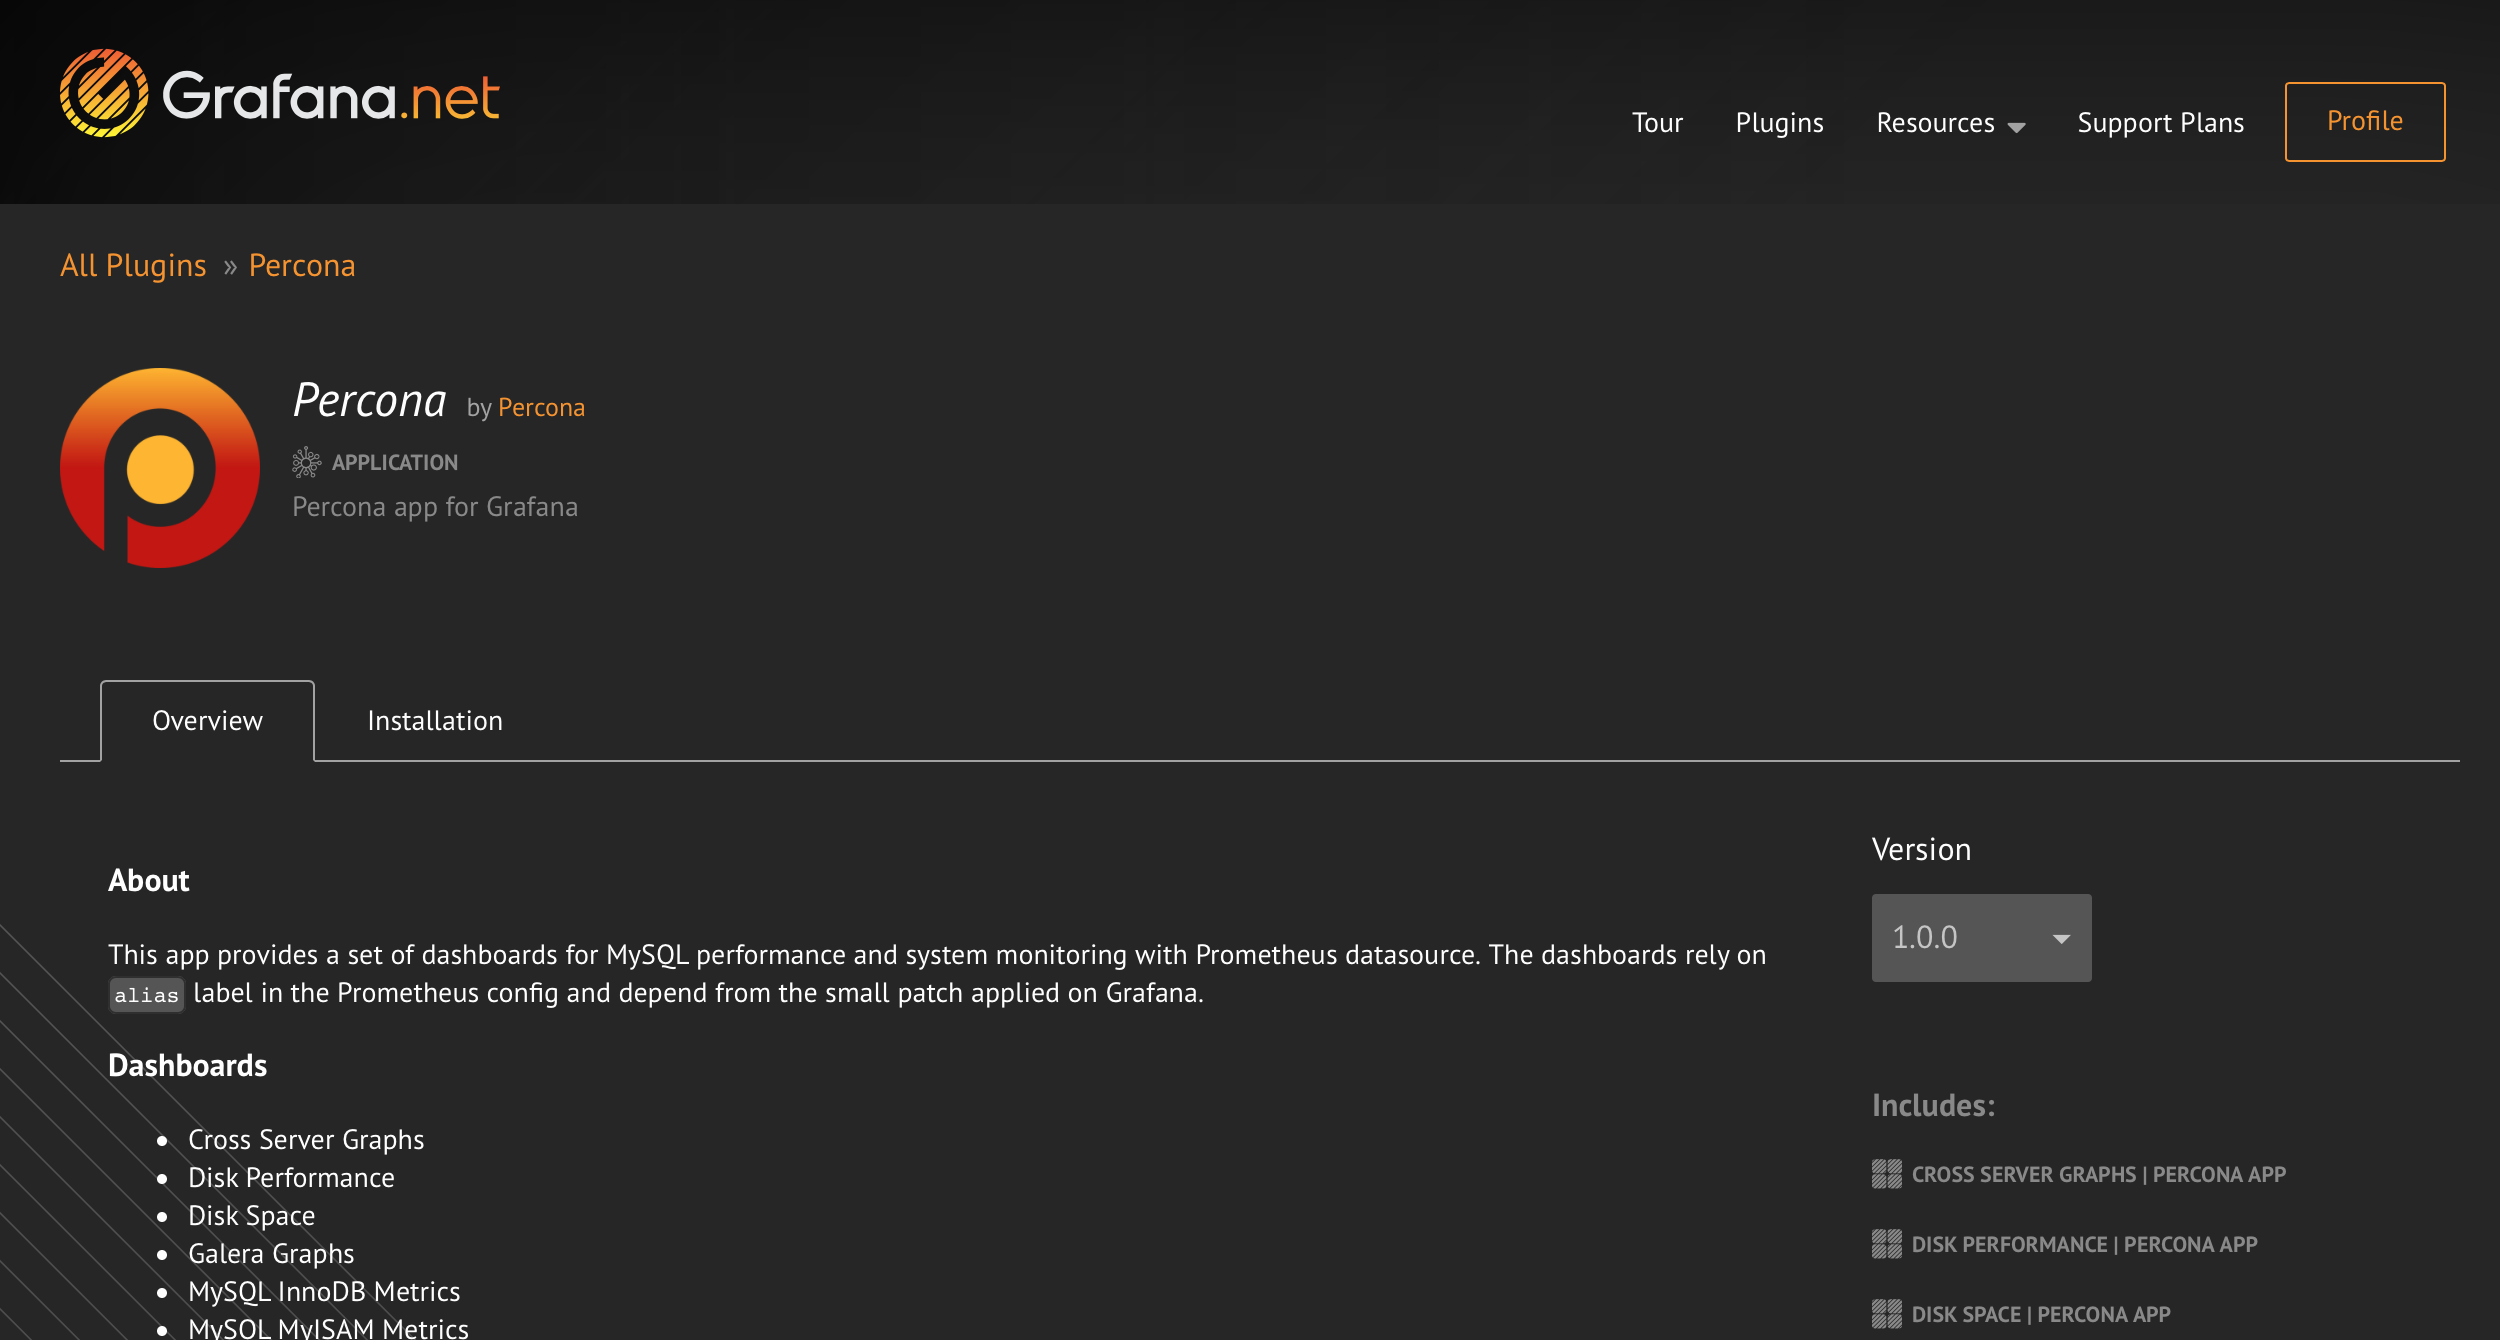
The dashboards in the app are:
The Grafana and Prometheus teams are doing a fantastic job of bringing monitoring and time-series to the next level. They are making collecting and graphing metrics simple and more usable.
See my previous blog post for step-by-step instructions on how to install Grafana and Prometheus. Get the Percona App for Grafana today!
Resources
RELATED POSTS


Do you have plan for other data source like InfluxDB?
I’m using InfluxDB+Telegraf+InfluxDB for mysql monitoring and would like to use percona dashboards.
InfluxDB+Telegraf+Grafana
Hi,I’m looking also for dashboard with influxdb/telegraf
I want to monitor the CPU Percent of Azure Database for MySQL(Paas). Is it possible?