
 We’re starting to wind down here at Percona Live 2016, but there are still talks to see even this late in the conference! One of the talks I saw was Sometimes “Less is More” for dash-boarding and graphing with Michael Blue, Senior DBA at Big Fish Games.
In this talk, Michael discussed how monitoring specific metrics can be more help than all the metrics. In a monitor/measure everything environment, to get the big picture sometimes “Less is More.” There are good monitoring tools available for DBAs, with tons of metrics to measure, but at a larger scale it seems impossible to get that big picture view of your environment without spending much of your time going over all the metrics your graphing, sifting through emails of false positives alerts, and reading tons of your cron job outputs. In the talk, Michael explained the approaches he took at Big Fish to create better dashboards for all audiences without visual overload, which helped the DBAs find potential issues that were not caught via conventional monitoring. This session included:
This session included:
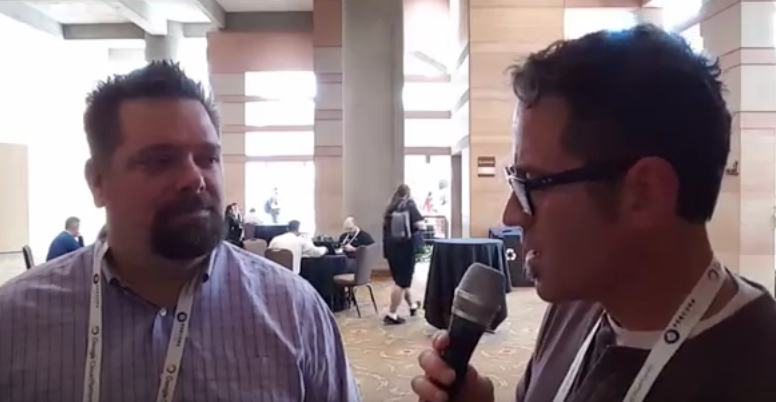
I had a chance to speak with Michael after his talk:
Resources
RELATED POSTS