 Percona announces the release of Percona Monitoring and Management 1.1.4 on May 29, 2017.
For installation instructions, see the Deployment Guide.
This release includes experimental support for MongoDB in Query Analytics, including updated QAN interface.
To enable MongoDB query analytics, use the mongodb:queries alias when adding the service. As an experimental feature, it also requires the --dev-enable option:
|
1 |
sudo pmm-admin add --dev-enable mongodb:queries |
NOTE: Currently, it monitors only collections that are present when you enable MongoDB query analytics. Query data for collections that you add later is not gathered. This is a known issue and it will be fixed in the future.
The QAN web interface was updated for better usability and functionality (including the new MongoDB query analytics data). The new UI is experimental and available by specifying /qan2 after the URL of PMM Server.
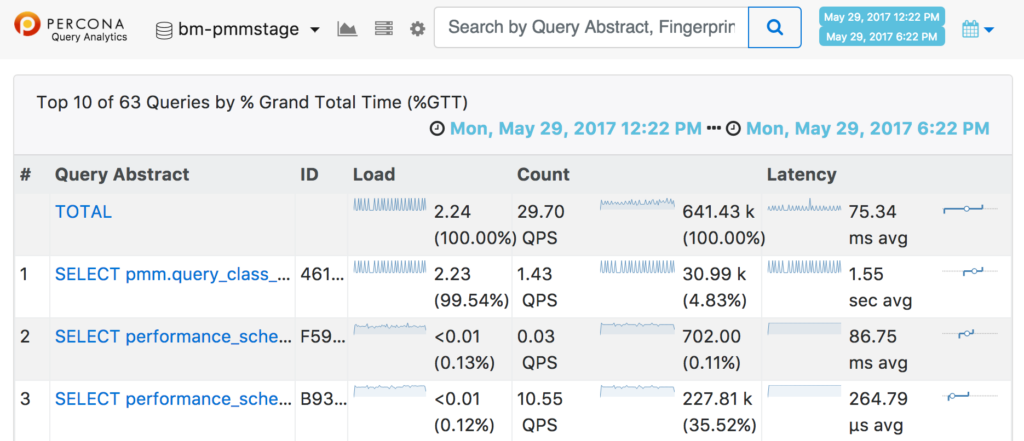
NOTE: The button on the main landing page still points to the old QAN interface.
You can check out the new QAN web UI at https://pmmdemo.percona.com/qan2
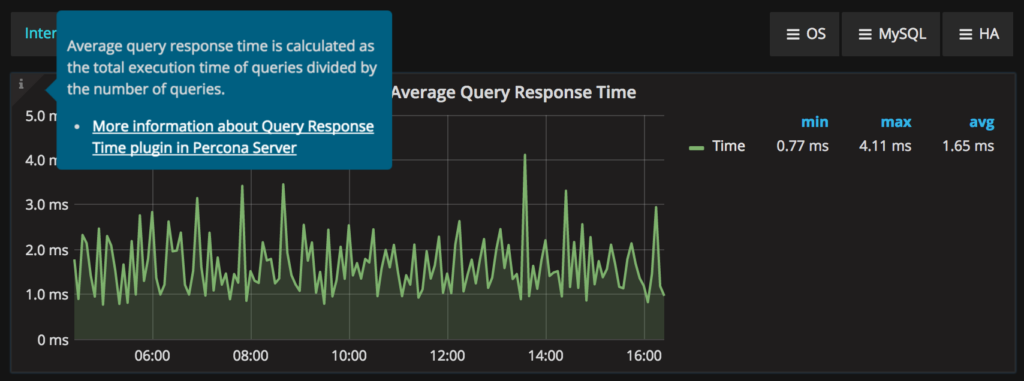 Similar tooltips will be gradually added to all graphs.
pmm-admin to enable MongoDB cluster connections.Percona Monitoring and Management is an open-source platform for managing and monitoring MySQL and MongoDB performance. Percona developed it in collaboration with experts in the field of managed database services, support and consulting.
PMM is a free and open-source solution that you can run in your own environment for maximum security and reliability. It provides thorough time-based analysis for MySQL and MongoDB servers to ensure that your data works as efficiently as possible.
A live demo of PMM is available at pmmdemo.percona.com.
Please provide your feedback and questions on the PMM forum.
If you would like to report a bug or submit a feature request, use the PMM project in JIRA.
Resources
RELATED POSTS