
pg_enhanced_query_logging (PEQL for short), a PostgreSQL extension that produces slow query logs in the same format MySQL and Percona Server users have been feeding into pt-query-digest for years. The idea is simple: reuse the tried-and-true tools and concepts we have been using for performing full query audits with low performance hits. This tool was conceived and developed for the recent Percona Build with AI Competition.log_min_duration_statement and a handful of related GUCs that print slow queries to the server log. That is useful, but the format is line-oriented and mixed in with everything else PostgreSQL writes there. On the MySQL side, the Percona Server extended slow query log goes much further: per-query counters, lock and I/O times, plan-quality flags, and a structured format that pt-query-digest can group by query fingerprint and rank by total time, average time, lock time, etc. This introduces the more powerful concept of performance of a family of queries, and not just individual query executions.peql-slow.log), not to PostgreSQL’s main error log. That keeps the error log clean for actual errors and lets us point the slow log at a separate mountpoint if we want to isolate its I/O from the rest of the server.peql.rate_limit_auto_max_queries and peql.rate_limit_auto_max_bytes give us a cluster-wide cap on logged queries per second and on bytes written per second. Useful for guaranteeing that the slow log itself never becomes a performance issue.peql.rate_limit_always_log_duration lets us say “but always log anything that takes longer than X ms”. The common queries get randomly sampled; the long-running ones always get logged.peql.log_query_plan = on, the full EXPLAIN ANALYZE output (text or JSON) is appended to each entry, so the plan that produced the metrics is right there next to them when we are reviewing the log later.
|
1 2 3 4 |
git clone https://github.com/guriandoro/pg_enhanced_query_logging.git cd pg_enhanced_query_logging make USE_PGXS=1 sudo make install USE_PGXS=1 |
$(pg_config --pkglibdir) and the SQL/control files into $(pg_config --sharedir)/extension/. The hooks live in the shared library, so we need to preload it. Add the following line to postgresql.conf (or edit your current value to include it):|
1 |
shared_preload_libraries = 'pg_enhanced_query_logging' |
|
1 |
CREATE EXTENSION pg_enhanced_query_logging; |
|
1 |
./test/deploy_docker_pg18_rhel.sh |
|
1 2 3 |
shared_preload_libraries = 'pg_enhanced_query_logging' peql.log_min_duration = 0 # log every query peql.log_verbosity = 'full' # emit all metric lines |
|
1 2 3 |
log_statement = 'none' log_min_duration_statement = -1 log_duration = off |
peql-slow.log inside PostgreSQL’s log_directory. The location and filename are configurable via peql.log_directory and peql.log_filename.peql-slow.log shows entries like this one (trimmed for brevity):|
1 2 3 4 5 6 7 8 9 10 11 12 13 14 15 |
# Time: 2026-03-11T09:15:32.847291 # User@Host: app_user[app_user] @ 10.0.1.42 [] # Thread_id: 48712 Schema: mydb.public # Query_id: -6432758210044805760 # Query_time: 1.285034 Lock_time: 0.000000 Rows_sent: 256 Rows_examined: 87500 # Shared_blks_hit: 4096 Shared_blks_read: 312 Shared_blks_dirtied: 0 Shared_blks_written: 0 # Temp_blks_read: 0 Temp_blks_written: 48 # Shared_blk_read_time: 0.024310 Shared_blk_write_time: 0.000000 # WAL_records: 0 WAL_bytes: 0 WAL_fpi: 0 # Plan_time: 0.003210 # Full_scan: Yes Temp_table: No Temp_table_on_disk: Yes Filesort: Yes Filesort_on_disk: No # JIT_functions: 4 JIT_generation_time: 0.001250 JIT_emission_time: 0.003100 SET timestamp=1741680931; SELECT o.id, o.total, c.name FROM orders o JOIN customers c ON c.id = o.customer_id WHERE o.status = 'pending' ORDER BY o.total DESC LIMIT 256; |
pt-query-digest at it directly:|
1 |
pt-query-digest --type slowlog $(pg_config --logdir)/peql-slow.log |
|
1 2 3 |
pt-query-digest --type slowlog \ --filter '$event->{Full_scan} eq "Yes"' \ $(pg_config --logdir)/peql-slow.log |
pt-query-digest installed, the standalone script can be downloaded directly:
|
1 2 |
curl -LO https://percona.com/get/pt-query-digest chmod +x pt-query-digest |
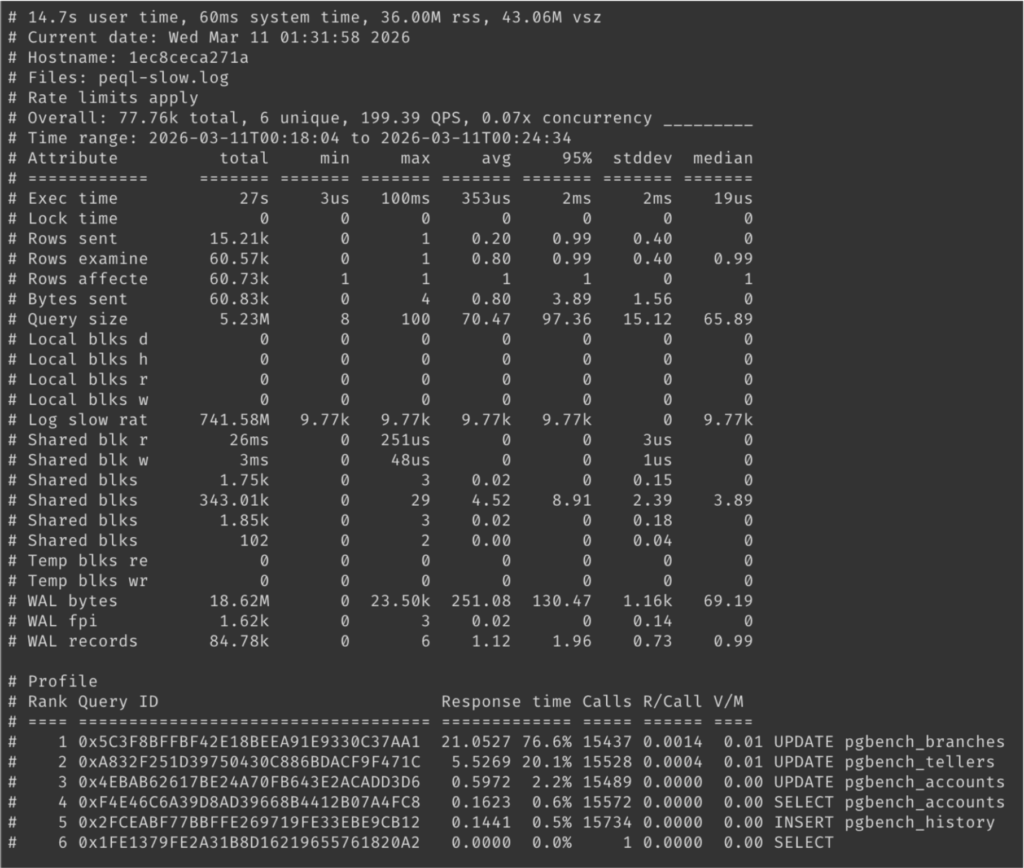
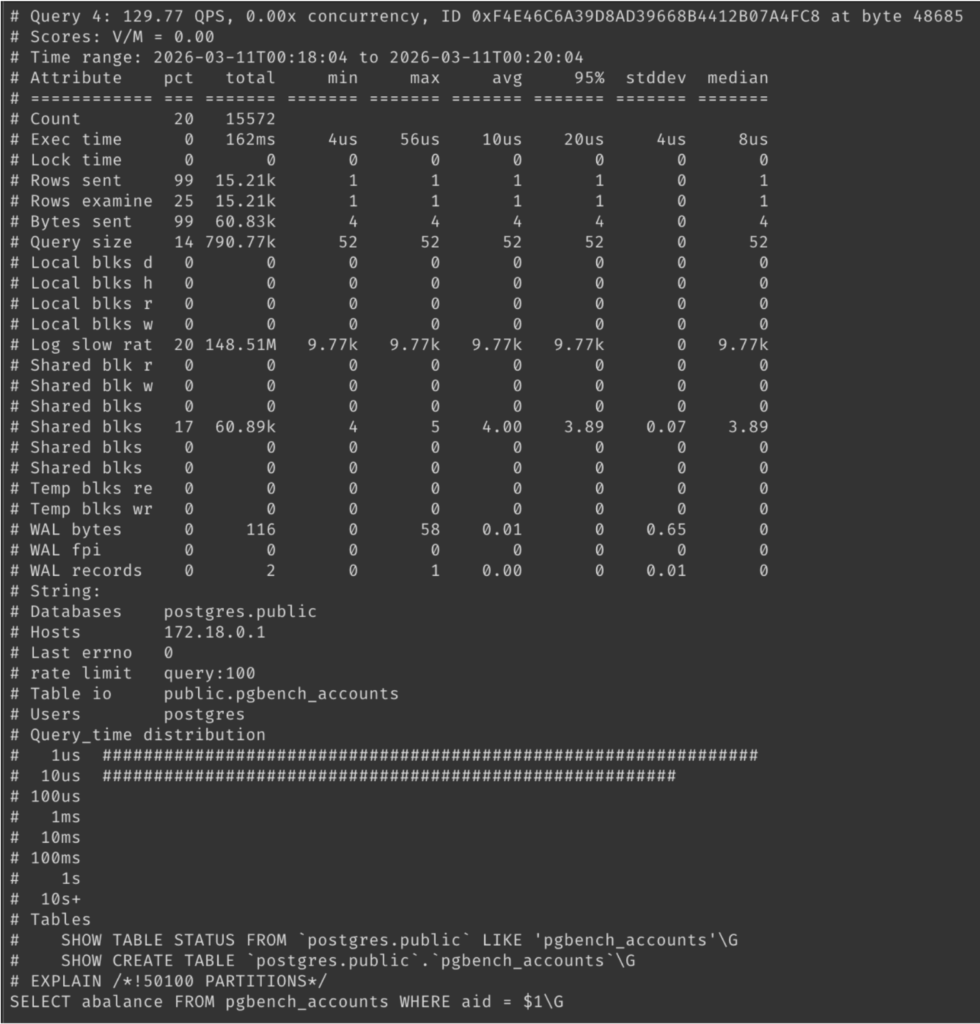
Example pt-query-digest outputs will look like the following images.
peql.rate_limit: 1-in-N sampling, either per session or per query, with a peql.rate_limit_always_log_duration override so that very slow queries are always captured even when sampling is on.peql.log_parameter_values: include actual bind parameter values for prepared statements alongside the placeholder query text.peql.log_query_plan: embed the full EXPLAIN ANALYZE output (text or JSON) inside the log entry, so the plan that produced the metrics is right there next to them. This can be expensive in terms of I/O, so use sparingly and only if needed.pt-query-digest compatibility is a feature, but it’s also a constraint: the MySQL slow log format was designed to be human readable, which means it’s way too verbose. For instance, the plan-quality flags line only has 5 bits of actual information, but uses around 100 bytes to encode them:|
1 |
# Full_scan: Yes Temp_table: No Temp_table_on_disk: No Filesort: Yes Filesort_on_disk: No |
YNNYN or 10010 (hence the 5 bits of information mentioned above), and have the position within the query log entry make it self-explanatory as to what this information is.pt-query-digest so that it can ingest it natively (--type peql or similar), or ship a small companion tool that either post-processes them or produces the same kind of profile reports pt-query-digest does today. Either way, the goal is to keep the analysis workflow we are used to while removing the format-imposed overhead from the producer side.pt-query-digest before, this is a great time to do it!Resources
RELATED POSTS